


You automated the counting, so why do the numbers still disagree in the meeting
Picture a plant in Rayong, Thailand, doing injection molding and assembly. You have just fitted counting sensors on 20 machines in total, made up of 12 molding machines, 5 assembly lines and 3 inspection stations. The plant runs two shifts of 8 hours each, 26 days a month. At the production meeting the following month, the dashboard shows yesterday’s output as 12,480. Accounting arrives with the finished goods figure from ERP, and it says 12,000. The handwritten daily report from the shop floor says 3,120. All three parties are confident their own number is right. And none of them is wrong.
Once a plant reaches this state, the meeting is consumed by an argument about which figure to believe. After that happens two or three times, people stop opening the dashboard and go back to the daily report spreadsheet they have always used. The sensors, the gateway and the cloud screen all keep running, but nothing they produce reaches a decision. The money you spent has turned into dead capital, even though the equipment is still working.
The cause is not sensor accuracy. Even if one photoelectric sensor missed 3 pieces out of 10,000, that would not explain the 480-piece gap between 12,480 and 12,000. The real cause is that the phrase “production count” already meant four different things inside the same plant, and nobody had decided which one the system was supposed to report.
The hard part of automated production counting is not the counting. It is deciding what counts as one piece. This article follows what happens when you defer that decision, all the way through, using the numbers from the model case above. Three conclusions up front. First, of the 1,640,000 baht initial cost, the equipment that actually does the counting (sensors, wiring and gateways) comes to 480,000 baht, or 29.3 percent of the total, while aligning definitions and connecting to upper systems accounts for 680,000 baht, or 41.5 percent. Second, automating all 20 machines at once gives a payback period of 13.2 years, which does not stand up as an investment. Narrowing the scope to the 6 bottleneck machines, dropping the upper system interface out of phase one and handling the definition work in house brings it to 4.6 years. Third, average capacity utilization in Thailand has fallen to 57.47 percent in 2026, so you cannot build a story around “produce more and pay it back.” Payback has to be assembled from labor hours and work in process alone.
The same day has four production counts — the number changes with where you count
Taking the model case above, here is the same day’s output counted at four different points. The assumptions are a daily manufacturing cost of 420,000 baht and 12,000 finished pieces, at 35 baht per piece.
| Counting point | That day’s number | What the difference contains |
|---|---|---|
| Mold shots | 3,120 | A 4-cavity mold, so this is not a piece count |
| Equipment outlet | 12,480 | 3,120 x 4. Includes defects and units awaiting rework |
| Good units after inspection | 12,180 | Excludes the 300 defective units |
| Finished goods after packing | 12,000 | Excludes the 180 units awaiting rework |
Ask “how many did we make yesterday” and this plant has four available answers, namely 3,120, 12,480, 12,180 and 12,000. None of them is a lie. For the molding maintenance engineer, the meaningful number is the shot count of 3,120, because mold life is managed in shots. For production engineering the meaningful number is 12,480 at the equipment outlet, because that is the only place where true machine capability is visible. Quality assurance wants the post-inspection 12,180, and accounting and sales are looking at the post-packing 12,000.
The problem is that only one of those four, the post-packing 12,000, matches the finished goods quantity in ERP. If you intend to connect the data to a production management system or to costing, the figure has to arrive at 12,000 somewhere along the line or it is unusable. Yet the easiest things to capture automatically are the shot count and the equipment outlet, because they come straight from the mold open/close signal on the molding machine, or from a photoelectric sensor mounted on the discharge chute.
The failure mode that hurts most is pushing raw shot pulses onto the screen as a piece count. With a 4-cavity mold the real piece count is four times higher, which produces the fourfold gap between 3,120 and 12,480. If the cavity count is not carried in the item master at implementation time, the screen counts the signal perfectly and still displays a quarter of the truth. Nobody notices until somebody looks at the dashboard and thinks the plant is better than that.

Deciding where to count is the same act as deciding what the investment is for. If you want to raise machine capability, count at the equipment outlet. If you want the numbers to reconcile with cost and inventory, count after packing. If you want both, you have to place counting points at both, which raises the point count and therefore the price. Start “wherever it is easiest to pick up a signal” without making that decision, and you will always end up adding the second location later, paying twice for both the installation work and the dashboard rework.
Four kinds of drift that stop the numbers from reconciling — point, good unit definition, time cut and batch counting
In practice, the reasons automated counts fail to reconcile in a meeting come down to four. Sensor detection accuracy is not among them. Here they are in order.
| Type of drift | Symptom | Gap in the model case | What has to be decided |
|---|---|---|---|
| Counting point | The dashboard does not match ERP finished goods | 480 pieces between 12,480 and 12,000 | Fix a single point as “the production count” |
| Definition of good units | Quality and production meetings report different numbers | Treatment of 300 defects and 180 units awaiting rework | When reworked units become good units |
| How the day is cut | Daily totals do not add up to the monthly total | The 8 hours of night shift that cross midnight | What time the production day begins |
| Batch counting | The number is far below or above actual capability | Fourfold, from a 4-cavity mold | Cavity count, tray quantity, carton quantity |
The first kind of drift, the counting point, is the subject of the previous section. Install a system without settling it and no amount of work on the other three will make the numbers agree. Settle it and everything else becomes a matter of operating rules.
The second is the definition of a good unit. In the model case, inspection rejects 300 units and a further 180 are held for rework and never reach packing. Those 180 become finished goods once the rework is done the next day. Unless you have decided which day’s production count carries them, two consecutive days of daily results are both wrong. If you book them on the day rework completes, the molding day closes at 12,000 finished units and the 180 are added to the next day. If you book them back on the molding day, you need a mechanism to rewrite daily data that has already been closed. Either choice works, but the dashboard and the reports have to follow the choice you made. How to hold the quality side of this data is covered in choosing a quality data management system.
The third is how the day is cut. With two shifts of 8 hours, the night shift always crosses midnight. Signals coming off the equipment roll over at exactly 00:00, while the shop floor writes its daily report as one day’s worth once the whole shift has finished. Put the two side by side and you get the maddening result of daily figures that never match while the monthly total does. Decide at the outset whether the production day starts at 08:00, at midnight, or at the shift clock-in, and make the dashboard and the ERP interface use the same cut. If you only reconcile the month-end close and leave the daily numbers alone, the data is worthless for spotting day-to-day abnormalities.
The fourth is batch counting. A 4-cavity molding machine, a tray of 20, a carton of 200. Inside a plant, material almost always moves in some kind of batch. What the sensor counts is shots, or trays, or cartons, and not pieces. Carrying that conversion factor per item is unglamorous work, and it is not optional. Worse, the factor changes at every product changeover. On the same molding machine, part number A may be a 4-cavity mold and part number B a 2-cavity mold. That means the machine has to know what is running right now, or the conversion cannot happen at all. At that moment you need production order information to reach the equipment, and the discussion expands abruptly into upper system integration. The point where costs balloon is usually this fourth kind of drift.
What you count with — five methods, and why accuracy is not what decides
There are realistically five ways to capture the count. Here is how they compare. Note that apart from vision, cost is driven far more by the number of points than by the method. The model case assumes roughly 8,500 baht per point for the sensor or stack light reader and 6,500 baht per point for wiring and panel work. Vision is the exception, because lighting design and per-part-number tuning push it outside that range.
| Method | What it captures | Machine stoppage | Machine modification | Where it fits |
|---|---|---|---|---|
| Stack light (andon tower) reading | Running, stopped and alarm states | Not required | Not required | Old machines whose warranty you cannot void, third-party machines you cannot open |
| PLC contact or device read | Piece count, state, part number | Brief stop required | Additional wiring required | Machines whose electrical drawings you own |
| Retrofit photoelectric sensor | Piece count only | Usually not required (brief stop depending on mounting) | Mounting bracket only | Processes where parts flow down a chute or conveyor |
| Pulse tap from an existing counter | Piece count only | Brief stop required | Branch from the terminal block | Machines that already have a mechanical counter |
| Vision-based counting | Piece count, type, basic appearance | Not required | Additional lighting | Processes with overlap or shape variation that simple detection cannot handle |
Put those five side by side and most people start asking which one counts most accurately. On a real shop floor, accuracy is not what decides. What decides is whether you can stop that machine, and whether you are allowed to modify it.
Adding wiring to a PLC terminal block on a running line means opening the panel and killing the power. On a machine that is booked solid and running weekends, it genuinely happens that the required 30 minutes cannot be found for six months. On leased machines, or machines still under a manufacturer’s maintenance contract, touching the inside of the panel can void the warranty on the spot. For any machine that hits either of those, PLC connection is off the table regardless of how accurate it is. What remains realistic is stack light reading or a retrofit photoelectric sensor on the chute.
Stack light reading is often dismissed as unable to give you a piece count directly. In fact, if the green lamp changes state once per cycle, you can count cycles, and where it does not, you can still derive an estimate from running time and standard cycle time. More importantly, it captures running, stopped and alarm states reliably. As the next section explains, that matters as much as the piece count for payback, or more. How to get started on existing machines without stopping them is set out in our factory IoT implementation guide.
Vision-based counting earns its place when small parts flow overlapping each other, or when the part shape is irregular. It does take time to get the lighting conditions right, and it usually needs retuning at every part number change, so the realistic approach is to reserve it for the one or two hardest points among the 20 machines. Trying to standardize the whole plant on vision from day one inflates both the initial cost and the commissioning period.
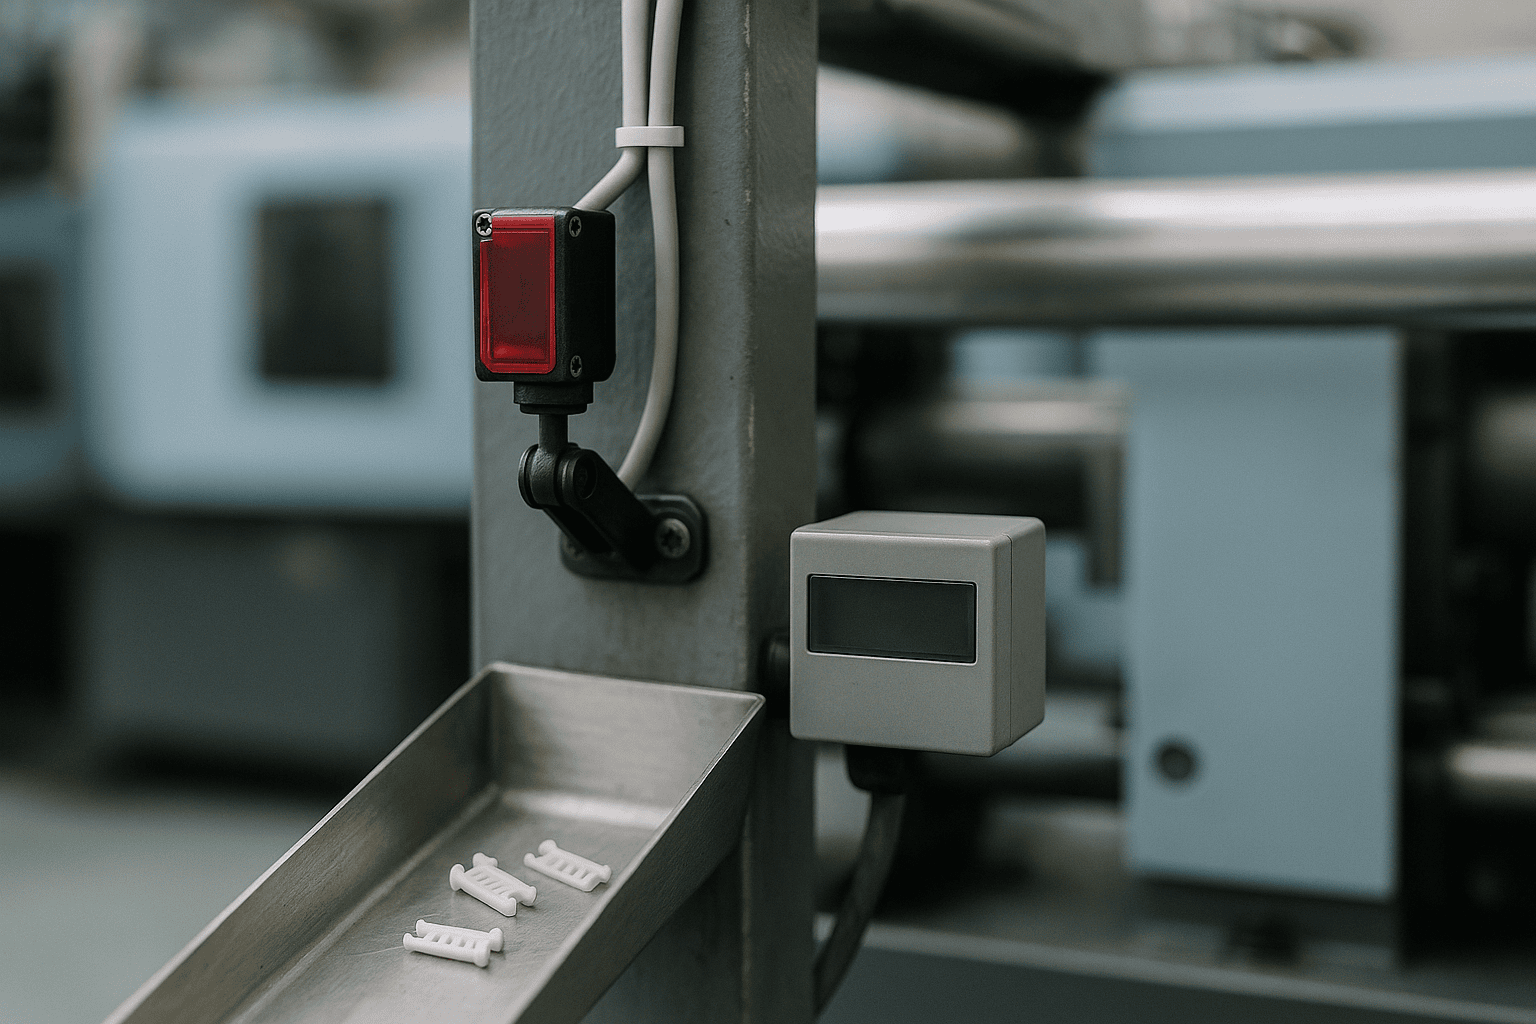
Whichever method you choose, the counting point and the conversion factor do not go away. Put a photoelectric sensor on the chute and you capture the equipment outlet figure of 12,480. Take the shot signal from the PLC and you capture 3,120. How you resolved the four kinds of drift comes before you select hardware. Reverse the order and you find out after installation that this position does not yield the number you wanted, and the installation work gets done twice.
Good unit counts and downtime come from the same signal
The most wasteful thing you can do with automated counting is capture the piece count and throw away the downtime. The two come from exactly the same signal, with no additional sensor.
The mechanism is simple. The count pulses from a photoelectric sensor arrive at intervals. On a machine with a standard cycle time of 20 seconds, a pulse arrives every 20 seconds. When that interval exceeds three times the standard cycle time, you can classify the gap as time when the machine was not running. Fixing the threshold as an absolute number of seconds makes long-cycle machines look permanently stopped, so it is safer to hold it as a multiple of that machine’s standard cycle time. In other words, simply recording the timestamp of each pulse hands you the piece count, the cycle time and the downtime all at once. With stack light reading it is even more direct, since any interval where green goes out and amber or red comes on is downtime by definition.
Despite this, a great many implementations are specified purely as “fill in the production count on the daily report automatically,” which leads to a design that discards timestamps and writes only a daily total to the database. The result is a dashboard with a bar chart that refreshes once a day and contributes nothing to improvement work. And when somebody later asks for downtime, the data was never kept, so there is no going back.
Throwing away downtime also destroys the payback case. Of the 231,858 baht in annual benefit in the model case, reduced transcription labor accounts for 119,970 baht, and the rest is 36,288 baht of overtime reduction and 75,600 baht of work in process reduction. Both of those exist only because downtime is visible. Because you can see where and for how long changeovers and minor stoppages occur, catch-up overtime falls by 21.6 hours a month. Buffers between processes can come down from 3 days to 2 days because you can now predict when the upstream process will stop. A design that captures only the piece count is throwing away half the benefit before it starts.
How to capture the small stoppages in particular is covered in detail in making minor stoppages visible and improving OEE. It is also worth knowing that the practice of holding good units and produced units as separate measures is written into an international standard. ISO 22400-2 defines key performance indicators for manufacturing operations management, and specifies PQ (produced quantity) and GQ (good quantity) as distinct indicators. Aligning your internal vocabulary with that split makes every later explanation easier.

The cost breakdown — counting hardware is only three tenths of the total
Here is the initial cost of automating all 20 machines in the model case at once.
| Line item | Amount (baht) |
|---|---|
| Counting sensors and stack light readers, 20 points (8,500 each) | 170,000 |
| Wiring and panel work, 20 points (6,500 each) | 130,000 |
| IoT gateways, 4 units (45,000 each) | 180,000 |
| Server and cloud initial build plus dashboards | 320,000 |
| Definition alignment (item master, cavity count, good unit definition, choice of counting point) | 380,000 |
| Interface to the production management system (one interface) | 300,000 |
| Commissioning, training and on-site attendance | 160,000 |
| Total | 1,640,000 |
The three rows at the top are the ones to look at. Sensors at 170,000 baht, wiring at 130,000 baht and gateways at 180,000 baht come to 480,000 baht combined. Against a total of 1,640,000 baht that is 29.3 percent. The hardware that physically counts things is a little under three tenths of the project.
Meanwhile, 380,000 baht of definition alignment plus 300,000 baht of production management system integration comes to 680,000 baht, or 41.5 percent of the total. Deciding how to count and wiring the result into upper systems costs more than the counting equipment does. The remaining 480,000 baht covers dashboard construction, commissioning and training.
Once you see that structure, the way you compare quotations changes. With three quotes on the table, most purchasing teams compare sensor unit prices and gateway counts. That is a little under three tenths of the money. Getting a point from 8,500 baht down to 7,500 baht saves 20,000 baht, which is 1.2 percent of the total. What deserves the comparison is how much of the definition alignment work each quotation actually includes.
Concretely, make every vendor write the following down. How many part numbers will have their cavity counts populated in the item master. Who decides the definition of a good unit and the rule for returning reworked units. Whether the vendor sits in on the decision about where the production day is cut. For how many days and how many lines they will run the reconciliation between the existing daily report format and the automated totals. Any quotation that marks these as “to be quoted separately” will look cheap and then generate roughly 380,000 baht of additional work later. The quotation that looked cheapest ending up the most expensive is almost always this pattern. Our broader view of process system costs is set out in the cost and breakdown of a process management system.
Payback never works on transcription labor alone — what separates 13.2 years from 4.6
Now the benefit side. Start with the labor as it stands today, at an effective hourly rate of 75 baht.
| Task | Hours per month |
|---|---|
| Operators writing production counts (30 seconds x 16 times per day x 20 machines) | 69.3 |
| Transcribing daily reports and compiling in Excel (clerical, 2.0 hours per day) | 52.0 |
| Investigating variances between output and inventory (monthly) | 12.0 |
| Total | 133.3 |
Multiply the total of 133.3 hours by the effective hourly rate of 75 baht and you get roughly 9,998 baht a month, or 119,970 baht over twelve months. That is the entire benefit of “no more daily reports.” Set the annual running cost of 108,000 baht (cloud subscription and similar) against it and only 11,970 baht is left. Divide the 1,640,000 baht initial cost by that and you get 137 years. Transcription labor alone does not even start a payback conversation.
So add the benefits that flow from the downtime data described in the previous section. Catch-up overtime around changeovers falls by 21.6 hours a month, which at an overtime rate of 140 baht is 36,288 baht a year. Buffers between processes come down from 3 days to 2 days, and one day of manufacturing cost at 420,000 baht multiplied by an annual inventory holding cost of 18 percent gives 75,600 baht. Together with 119,970 baht of transcription labor, the annual benefit reaches 231,858 baht. Subtract the 108,000 baht running cost and the net benefit is 123,858 baht. Divide 1,640,000 baht by that and you get 13.2 years. Better, but still not an approvable investment.
This is the point to change the question. Do you genuinely need to count all 20 machines? Narrow the scope to the 6 bottleneck machines, move the production management system interface out of phase one, and take the lead on definition alignment yourself with the vendor only supporting, and the initial cost looks like this.
| Line item | Amount (baht) |
|---|---|
| Sensors and stack light readers, 6 points | 51,000 |
| Wiring and panel work, 6 points | 39,000 |
| IoT gateway, 1 unit | 45,000 |
| Cloud dashboards (initial) | 120,000 |
| Definition alignment (in house, support only) | 90,000 |
| Commissioning and training | 60,000 |
| Total | 405,000 |
The annual running cost of this configuration is 28,800 baht. On the benefit side, with only 6 machines in scope, transcription labor falls to 42,840 baht. That breaks down as 20.8 hours a month of operator writing across 6 machines, 20.8 hours a month of report transcription and compiling, and 6.0 hours a month of variance investigation, a total of 47.6 hours multiplied by 75 baht and twelve months. Report transcription only drops to about four tenths of the 52.0 hours because the compiling work itself does not disappear while handwritten reports remain for the other 14 machines. Variance investigation is likewise halved to 6.0 hours, since variances involving out-of-scope machines are still there. Overtime reduction, on the other hand, survives intact at 36,288 baht, because catch-up overtime originates in changeovers at the bottleneck. Work in process reduction is limited to the buffers immediately around the bottleneck, so it is halved to 37,800 baht.
| Item | All 20 machines at once | 6 bottleneck machines |
|---|---|---|
| Initial cost (baht) | 1,640,000 | 405,000 |
| Annual running cost (baht) | 108,000 | 28,800 |
| Total annual benefit (baht) | 231,858 | 116,928 |
| Net benefit (baht) | 123,858 | 88,128 |
| Payback period | 13.2 years | 4.6 years |
The narrowed configuration’s initial cost of 405,000 baht is 24.7 percent of the full rollout. Yet its annual benefit of 116,928 baht retains 50.4 percent of the full rollout’s. Cost falls to a quarter while benefit stays at half, and that asymmetry is the whole point.
The reason is plain. Overtime reduction and work in process reduction, which make up most of the benefit, are concentrated at the bottleneck machines. Counting a non-bottleneck machine does not cut overtime there, because that machine already has slack. Inventory only thins slightly in buffers away from the constraint. In other words, investment in the other 14 machines has almost nothing but transcription labor to pay it back. The 13.2-year figure for the full rollout is what you get when that fact is diluted across an average.
The practical conclusion is straightforward. Rather than fitting everything at once, pick the 6 machines that stop the whole plant when they stop, and run just those at 4.6 years. Add the remaining 14 later, on cheaper hardware, at the point where the daily report burden genuinely becomes intolerable.
What changed in Thailand in 2026 — 57.47 percent utilization and a frozen wage
Now place this calculation in the context of Thailand in 2026. One of the usual assumptions collapses here.
According to the Office of Industrial Economics (OIE) at the Ministry of Industry, the Manufacturing Production Index (MPI) for June 2026 was down 3.10 percent year on year, the steepest decline since November 2025. The same release put second quarter 2026 MPI down 1.79 percent and average capacity utilization at 57.47 percent. Back in January 2026, the Joint Standing Committee on Commerce, Industry and Banking (JSCCIB) forecast 2026 GDP growth of 1.6 to 2.0 percent and exports of minus 1.5 to minus 0.5 percent, noting that utilization had fallen below 60 percent in several sectors, well short of the normal 70 to 80 percent. Six months later, the OIE numbers have essentially traced that outlook.
The effect of a 57.47 percent utilization rate on an investment plan is very concrete. Investments that make production counts visible have traditionally been justified as “find the bottleneck, raise capacity, produce more and grow revenue.” When average utilization is below 60 percent, raising capacity gives you nothing to sell. The produce-more payback story cannot be told.
Which means that in Thailand in 2026, payback on automated production counting can only be assembled from labor hours and work in process. The 4.6 years calculated in the previous section assumes zero benefit from increased output. The flip side is that when utilization recovers, payback will be faster than that. But the investment decision has to be made on today’s assumptions. A business case padded with benefits conditional on “once utilization recovers” may get approved, and it will miss on actuals.
The other assumption is labor cost. According to JETRO, the minimum wage in Bangkok rose to 400 baht per day effective 1 July 2025, up from 372 baht. No further revision for 2026 has been confirmed, so this article treats it as frozen. That matters because the 119,970 baht of transcription labor savings scales with the wage level. If wages rise every year, the labor savings rise with them and payback pulls forward. If they are frozen, they do not. The 13.2 years and 4.6 years in the model case are conservative figures calculated on a frozen wage.
On the question of how much downtime manual data collection conceals, Fabrico, a maintenance software vendor, stated in a February 2026 article that manual collection hides up to 30 percent of actual downtime. That is a vendor claim without independent verification, so it is not used as a basis for any of the investment arithmetic here. It is offered only as context.
How to roll it out — one line in 90 days
Even with the narrowed configuration, do not try to bring all 6 machines up at once. Take one line through 90 days first, lock the definitions there, then replicate. It finishes sooner that way.
| Period | What to do | Completion criterion |
|---|---|---|
| Days 1 to 15 | Decide the counting point, good unit definition, production day cut and cavity counts on paper | The four drift decisions exist as a single document |
| Days 16 to 30 | Reconcile manual counts against those decisions on the target line | Hand-calculated figures under the agreed definitions match ERP finished goods |
| Days 31 to 50 | Sensor mounting, wiring and gateway installation | Total machine stoppage time stayed within plan |
| Days 51 to 70 | Publish the dashboard and run handwritten reports in parallel | Zero days on which the difference cannot be explained |
| Days 71 to 90 | Retire handwritten reports and move the variance investigation procedure | The floor runs its meetings on the automated figures |
The most important stage in this plan is days 16 to 30. At that point nothing has been installed. All you do is check whether the figure you counted by hand, following the definitions you agreed, matches the ERP finished goods figure of 12,000. If it does not match at this stage, it will not match after you fit sensors either. If it does match, everything after that is a matter of getting a machine to do the same arithmetic, so post-installation trouble is confined to wiring and communications.
Most failed implementations skip those 15 days and start at the installation work on day 31. If the definition argument only begins once the dashboard is live, you end up rewriting the aggregation logic again and again, and the shop floor loses confidence every time. The 380,000 baht price tag on definition alignment is what it costs when an outside party leads that 15-day discussion. If your own production control staff can lead it, the figure drops to 90,000 baht. Whether you can take that in house is the real fork between 4.6 years and 13.2 years.
Do not skip the parallel run from day 51 either. Keeping both handwritten and automated counts going for 20 days is tedious, but if you do not close out the causes on days where they differ, then the first time the numbers disagree after retirement, everyone goes straight back to Excel. The three classic issues to close out during the parallel run are conversion factors at part number changeover, the date boundary on night shift, and the return of reworked units.
Seven things to settle before you request a quotation
Before you ask for quotations, settle the following seven points internally and put them in writing. With these settled, vendor quotations become comparable. Without them, each vendor invents its own assumptions and you lose any ability to tell where the price differences come from.
- Choose one point to call the production count, from mold shots, equipment outlet, good units after inspection, or finished goods after packing. To reconcile with ERP, that is the post-packing 12,000
- Decide whether the 180 units awaiting rework belong to the production count of the molding day or the day rework completes
- Decide what time the production day begins, and write down explicitly how a night shift crossing midnight is handled
- Decide who populates cavity counts, tray quantities and carton quantities per part number, and count how many part numbers are in scope
- Decide how many machines are in scope, whether that is the 6 bottleneck machines or all 20
- Decide whether the production management system interface is in phase one or deferred to phase two
- Decide whether downtime and cycle time are recorded from the start, and do not settle for a daily total
Of the seven, the fifth and sixth move the money most. Narrowing from 20 machines to 6 takes the initial cost from 1,640,000 baht to 405,000 baht, or 24.7 percent. Simply deferring the interface removes 300,000 baht from the initial investment. It is not technical difficulty but these two scope decisions that set the payback period.
The seventh barely affects the price but affects the benefit enormously. Recording timestamps costs essentially nothing extra, yet without those records the 36,288 baht of overtime reduction and the 75,600 baht of work in process reduction have no basis at all. Put one line in the specification requiring that each count be stored individually with its timestamp.
Frequently asked questions
How much does it cost to automate production counting
In the model case, automating all 20 machines at once costs 1,640,000 baht initially plus 108,000 baht a year to run. Narrowing to the 6 bottleneck machines, dropping the production management system interface and handling definition alignment in house brings that to 405,000 baht initially and 28,800 baht a year. The notable feature of the breakdown is that the counting hardware, meaning sensors, wiring and gateways, is 480,000 baht or 29.3 percent of the total, while definition alignment and upper system integration take 680,000 baht or 41.5 percent. What moves the number is not equipment unit prices but the machine count in scope and the extent of the definition work.
Can old existing machines have their production counted automatically
Yes, though your choice of method is limited. On machines whose panel you cannot open, or where opening it creates a maintenance contract problem, you use stack light reading or a retrofit photoelectric sensor on the discharge chute or conveyor. Neither touches the inside of the machine, so warranty and drawing issues are avoided. Stack light reading may not give you a direct piece count, but it reliably captures running, stopped and alarm states. Once you have downtime, the large parts of the benefit, namely overtime reduction and work in process reduction, still hold.
Which is better, stack light reading or a PLC connection
On accuracy alone, the PLC connection. It gives you not only the piece count but the part number and setpoints, which allows automatic switching of cavity counts. But accuracy is not what decides. What decides is whether you can stop that machine and whether you can modify it. A PLC connection requires time with the panel open and the power off, and on leased machines or machines under maintenance contract there is a warranty question as well. The realistic sorting rule is stack light reading for machines you cannot stop, PLC connection for machines you can stop and have drawings for. Mixing both across a plant is perfectly fine.
Can cycle time be measured at the same time as the production count
Yes, and no additional sensor is needed. If you record each count pulse with its timestamp, the interval between pulses is the cycle time. From the same data you can extract any interval exceeding the threshold as downtime. In other words, piece count, cycle time and downtime all come from one signal. Conversely, a design that stores only a daily total leaves you with the piece count and nothing else. Make sure the specification states that each count is stored individually with a timestamp.
Is it pointless unless it connects to the production management system
In the early stage it delivers benefit without that connection. The narrowed configuration in the model case leaves the 300,000 baht interface out of phase one, and still retains 116,928 baht of annual benefit and pays back in 4.6 years. The interface starts to earn its keep when you want cavity counts to switch automatically at part number changeover, and when you want output to feed costing directly. Settling the definitions and letting the floor get used to the numbers first, then adding the interface once the figures are trusted, produces far less rework.
What changes when output can be seen in real time
What changes is not the meeting but the actions you take within the same day. If a delay only shows up in tomorrow morning’s report, the countermeasure lands the following day at the earliest. With hourly plan and actual side by side, you can decide at midday to bring in support or to reorder changeovers, and act on it that day. The 21.6 hours a month of overtime reduction assumed in the model case comes entirely from that same-day replanning. A dashboard that refreshes once a day, by contrast, does not reduce overtime.
How many months until it pays back
The model case is at a scale measured in years, not months. Automating all 20 machines at once gives 13.2 years, which does not stand up as an investment. Narrowing to the 6 bottleneck machines, dropping the upper system interface and handling definition alignment in house gives 4.6 years. What creates that difference is not equipment pricing but the structure whereby non-bottleneck machines carry no overtime reduction, leaving transcription labor as almost the only source of payback. Because average utilization in Thailand in 2026 is 57.47 percent and no increased-output benefit can be assumed, the 4.6 years is calculated with zero contribution from higher volume.
Summary
The hard part of automated production counting is not the counting but deciding what counts as one piece. The same day carries four production counts inside one plant, and in the model case the four figures of 3,120 mold shots, 12,480 at the equipment outlet, 12,180 good units after inspection and 12,000 finished goods after packing all hold simultaneously. Only 12,000 reconciles with ERP. Install hardware while that decision is still outstanding, and a system that is working perfectly will have its numbers rejected in a meeting, leaving the investment running but unused.
The cost structure confirms the same point. Of the 1,640,000 baht initial cost, the counting hardware is 480,000 baht or 29.3 percent, while definition alignment and upper system integration are 680,000 baht or 41.5 percent. When you compare quotations, compare the scope of the definition work, not the sensor unit price.
On payback, all 20 machines at once gives 13.2 years, while narrowing to the 6 bottleneck machines, dropping the upper system interface and doing definition alignment in house gives 4.6 years. Cost falls to 24.7 percent and 50.4 percent of the benefit survives, because non-bottleneck machines carry no overtime reduction and have almost nothing but transcription labor to pay them back. On top of that, Thailand in 2026 sits at 57.47 percent average capacity utilization with the minimum wage frozen at 400 baht per day. With neither higher output nor rising wages available to add to the payback case, narrowing the scope until it works on labor hours and work in process alone is the only route to getting this investment approved right now.
It is perfectly fine if you have not yet decided where to count. Starting from a comparison of your existing daily reports against ERP finished goods, we can work through with you which point deserves to be called the production count and which machines should be treated as the bottleneck and tackled first. With photographs of the existing machines and your current daily report format, we can usually sort the methods and give you a rough order of magnitude on the spot. Get in touch through our contact form.
References
- Thailand’s industrial output slips 3.1 pct in June (Xinhua, 27 July 2026)
- FTI warns of perfect storm as 2026 GDP growth seen at 1.6-2.0 percent (The Nation Thailand, 5 January 2026)
- Bangkok minimum wage raised to 400 baht per day (JETRO, 4 July 2025)
- ISO 22400-2:2014 Key performance indicators for manufacturing operations management (ISO)
- OPC UA for Machine Tools – KPI Calculation (OPC Foundation)
- OEE Data Collection Methods (Fabrico, 3 February 2026)
- Photoelectric Sensors Application Examples (OMRON)


