


You installed a quality data management system, yet when a defect appears nobody can answer which machine produced the lot, or under what process conditions. This is a common state in Japanese-owned factories in Thailand. The cause is not the product you selected. It is that the system went live before anyone decided the key that ties each recorded value to a point in time, a lot, a machine and an operator. This article reframes quality data as three layers, Record layer, Link layer and Analyze layer, and then works through the four granularities of the linking key, a five-layer cost breakdown, and a 90-day sequence for getting there.
What a quality data management system actually is: the Record, Link and Analyze layers
In practice the phrase “quality data management system” covers an extremely wide range. It can mean a tablet app for entering inspection results. It can mean a mechanism that pulls measurements automatically out of gauges. It can mean a tool that draws SPC control charts. Lining up vendor brochures side by side rarely produces a meaningful comparison, because each vendor is describing a different layer.
So this article splits quality data management into the following three layers. This split is the backbone of everything that follows.
| Layer | What the layer does | Typical means | What happens when it is missing |
|---|---|---|---|
| 1. Record layer | Captures inspection results, work records and measured values in digital form | Electronic forms, gauge integration, AI visual inspection, signal acquisition from equipment | Paper and Excel survive, and aggregation stays manual |
| 2. Link layer | Ties each record to a time, a lot or individual unit, a machine, an operator and a set of process conditions | Lot and serial key design, master data cleanup, clock synchronization, definitions for handover between processes | The data exists, yet the responsible process cannot be identified |
| 3. Analyze layer | Stratification, Pareto, process capability, factor analysis, and output for audits and complaints | BI dashboards, SPC, factor analysis, record extraction and report output | Analysis depends on one person’s Excel work and cannot be reproduced |
Most factories install layer 1 and stop there. Inspection records move onto tablets, paper volume drops, aggregation gets a little faster. Up to that point the benefit is real. But the moment a defect occurs, what you want to know is when that defective part was made, on which machine, and under what process conditions, and layer 1 records alone will rarely produce that answer. The link in layer 2 is absent.
What decides whether the investment succeeds is not product selection, it is deciding up front what the linking key in layer 2 will be. That is the argument of this article.
Layer 1, the Record layer: turning numbers into data
The Record layer is the easiest to picture and the most crowded with competing products. It mainly covers the following.
- Electronic forms: replacing paper checksheets, inspection certificates and daily patrol sheets with entry screens on tablets or PCs
- Gauge integration: bringing in readings from calipers, micrometers, CMMs, hardness testers and similar instruments without manual typing
- AI visual inspection and image inspection: judging scratches, chips and foreign matter from camera images, and retaining both the judgement and the image
- Signal acquisition from equipment: collecting running state, temperature, pressure, torque and cycle time from PLCs and sensors
- Work records: recording who did which operation, when, and following which procedure
Building the Record layer produces value on its own, in the form of fewer transcription errors and less time spent searching. If you are still deciding where to start digitizing quality records, how to move from paper forms to a paperless factory works through the entry points process by process, and is worth reading first.
However, stacking up Record layer investments alone tends to produce this situation.
- The inspection records sit on tablets
- The equipment temperature and pressure data sits in a different system
- The visual inspection judgements sit inside the camera vendor’s software
- The operator record sits in the production result entry of the production control system
Each item is recorded correctly, but there is no key that joins them horizontally. That is the problem the Link layer exists to solve.
Layer 2, the Link layer: key design is the substance
The Link layer takes every recorded data point and attaches a label saying what it belongs to, so that it can be joined later. There are broadly five kinds of label.
| Linking axis | Examples | Questions you cannot answer without it |
|---|---|---|
| Time | 2026-08-06 14:32:10 (single plant-wide clock) | When was it made, and what else was happening at the moment of the abnormality |
| Lot or individual unit | Lot number, serial number, production number | How far does the recall have to reach |
| Equipment | Equipment ID, machine number, mould ID, jig ID | Is the problem concentrated on one machine |
| Operator | Employee ID, team, shift | Is this a training or procedure issue |
| Process conditions | Temperature, pressure, speed, torque, recipe number | Is there a correlation between conditions and defects |
With all five in place, a question such as “stratify last month’s cosmetic defects on product A by machine and by shift” can be answered in minutes. Lose any one of them and stratification along that axis becomes impossible. The usual gap is equipment ID together with process conditions, which produces the state where defects are visible but neither the machine number nor the conditions at the time are known.
Link layer design is less a question of system functionality than a question of agreed rules. How lot numbers are assigned, how clocks are aligned, the naming convention for equipment IDs, how a key is carried across a process boundary. None of this arrives with a purchased product. You have to decide it yourself, which is exactly why it should be started before product selection.
Layer 3, the Analyze layer: design backwards from the output
The Analyze layer turns linked data into actual decisions. There are four representative outputs.
- Stratification and Pareto: splitting defects by machine, by part number, by shift and by defect mode to see where they concentrate
- Process capability (Cp/Cpk) and control charts: seeing how measurement variation sits against specification, and whether a trend is emerging
- Factor analysis and correlation analysis: exploring the relationship between process conditions and defect rate. Where machine learning is used, the common approach is to learn patterns from data that integrates equipment sensors, quality inspection and production results in order to narrow down contributing factors, typically combined with real-time visualization on a BI dashboard
- Output for audits and complaint response: extracting the production records, inspection records, operator and equipment for a specified lot, in a specified format
The important point here is the order: the output of the Analyze layer determines the requirements of the Link layer. If the output is “when the customer gives us the serial number of a defective part, we want to submit the production conditions within 24 hours”, then the linking key has to be the individual serial. If the output is only “we want to review defect trends by machine each month”, then lot level plus equipment ID is enough. Decide the key without deciding the output and you will almost always end up either over-built or short.
Why factories stop at layer 1
There are three reasons.
First, layer 1 produces visible results. Less paper, faster aggregation, changes you feel immediately. Layer 2 produces nothing visible on the day it is finished. Its value appears when a defect occurs or when an audit arrives, and in normal operation it looks like nothing.
Second, layer 1 can be bought, layer 2 can only be decided in-house. Vendors propose what their own product covers, so key design, which is homework on the customer’s side, rarely appears in a proposal.
Third, layer 2 crosses departments. Unifying the definition of a lot requires agreement from production, quality assurance, production control and IT. Because it cannot be completed inside one department, it gets postponed.
The result is a factory where the records are digitized but the cause of a defect still cannot be identified. The next section breaks that state into five typical patterns.

Five typical patterns behind “we have the data but cannot find the cause”
From here we look at what is actually happening on the shop floor. In every case the Record layer is in place, but the Link layer is missing, so analysis never comes together. Read through and check which ones apply to your own plant.
Pattern 1: the inspection record has no equipment ID
This is the most common. The inspection record contains the date, part number, lot number, inspection items, measured values, judgement and inspector name. But it does not say which machine produced the part.
Inspection is often performed in a batch at the end of the process, and from the inspector’s point of view the job is simply to measure the parts in front of them, so there is no reason to be conscious of the machine. As a result, the equipment ID falls out of the record.
When the defect rate rises in that state, your options are limited. You can look at it by part number and by date, but you cannot tell whether it is concentrated on machine number 3 or spread evenly across all machines. If it were only machine 3, an inspection of the mould or the machine might solve it, yet the team starts suspecting material or environment as a plant-wide issue. The first move in narrowing the problem is unavailable.
The fix is simple: keep a record on the production result side saying which machine produced this lot, so that it can be joined to the inspection record through the lot number. You do not necessarily have to make inspectors enter an equipment ID on the inspection screen. It is enough that the lot number can be traced through to the equipment.
Pattern 2: the clocks differ between systems
Equipment data carries the time from the equipment PC, inspection records carry the time from the tablet, the production control system carries the time from the server. If they are not synchronized over NTP, gaps of a few minutes to a few tens of minutes appear.
Nobody notices in normal operation. The problem surfaces during abnormality analysis. The inspection record says defects started increasing around 14:20, but the equipment log shows nothing at 14:20. In fact the equipment clock was running seven minutes fast, and the corresponding event sits at 14:27 in the equipment log. Analyze without questioning those seven minutes and you reach the false conclusion that nothing was wrong with the equipment.
Clock drift breaks any design that uses time plus equipment as a linking key at the root, so it feeds directly into the choice of granularity discussed later. The countermeasure itself is not difficult. Synchronize every device in the plant that keeps records to the same NTP server, standardize the time zone on ICT (UTC+7), and store records with the time zone attached. If data is shared with a head office in Japan, decide how the two-hour difference between JST and ICT is handled at the outset.
Pattern 3: each process defines a lot differently
This one is hard to spot and has a large impact.
For example, moulding assigns lot numbers by material lot. The next machining process treats one day’s production as one lot. Assembly groups lots by customer shipping unit. Within each process it is consistent, and nobody is doing anything wrong.
But as soon as you try to trace across processes, the correspondence is not one to one. One moulding lot splits into three machining lots, and two machining lots merge into one assembly lot. Without a record of those splits and merges, you cannot go back from an assembly lot to a moulding lot.
A request such as “a defect occurred, we want to trace back to the material lot” stops being possible at that point. Because you cannot trace, you have to draw the suspect range wide. The recall scope swells, and the sorting workload swells with it.
The fix is not to unify the lot definition across processes, which is rarely realistic, but to record the parent-child relationship every time a split or merge occurs. As long as you retain that machining lots L2a and L2b were made from moulding lot L1, and assembly lot L3 was made from machining lots L2a and L2b, differing definitions do not stop you from tracing. This is the core of internal traceability, and the precondition for the in-process defect tracing discussed later.
Pattern 4: Excel files split by person and by line
Plenty of factories still manage quality records in Excel. The problem is not Excel itself, it is that the files are fragmented.
- A separate file per line
- A separate file per month
- Slightly different layouts per person in charge
- Defect names drifting between variants such as “scratch”, “scuff” and “surface mark”
- Somebody inserted one column, and the aggregation macro stops working for every file after that
Trying to see an annual trend in that state means first collecting the files, harmonizing the wording and aligning the column positions. Half a day disappears before you reach any analysis. So the monthly report ends up being just this month’s defect rate, and never gets as far as cause investigation.
What makes it worse is that inconsistent naming breaks the linking itself. If equipment IDs appear as “machine 3”, “No.3” and “M-003” in the same dataset, they cannot be joined automatically. This is precisely why master data cleanup, meaning a unified code system, belongs to the Link layer and has to come before the Analyze layer.
Pattern 5: non-conformance reports live in a different system from inspection records
Inspection records sit in the quality system. Non-conformance reports (NCR) and corrective action reports (CAR) sit on the file server as Word documents. Customer complaints are managed in email and a logbook.
When those three are not connected, the following becomes impossible.
- You cannot immediately tell whether a corrective action was ever taken for a given defect mode in the past
- You cannot confirm with data whether defects actually decreased after a corrective action
- You cannot pull the inspection record for the product lot behind a customer complaint
The result is that the same corrective action gets repeated every few years. When the person in charge changes, the memory of past countermeasures leaves with them.
The fix is to make sure non-conformance and corrective action records always carry a lot number, or an individual serial, so that they can be joined to inspection records using the same key. The point is not to standardize document formats. The point is to attach a key.
Lining up the five patterns again makes it clear that none of them is a problem of missing records.
| Pattern | State of the Record layer | What is missing |
|---|---|---|
| 1. No equipment ID | Inspection records are being captured | The key that connects a record to a machine |
| 2. Clocks out of sync | Each system has a timestamp | A single time reference |
| 3. Differing lot definitions | Every process assigns lot numbers | The parent-child relationship between processes |
| 4. Fragmented Excel | The data exists | A unified code system and storage location |
| 5. Non-conformance managed separately | Non-conformance reports are being written | The key that joins them to inspection records |
None of these is solved by more investment in the Record layer. What solves them is Link layer design. Skip that and buy a high-end analysis tool, and because the incoming data cannot be joined, what comes out is a defect rate chart by part number and little else.
Three external factors that make 2026 a reasonable time to revisit quality data management
As noted, the value of building the Link layer is hard to see in normal operation. Even so, there are three reasons in the external environment to consider starting in 2026.
Factor 1: the ISO 9001 revision, scheduled for 2026
ISO 9001 is going through its first revision in eleven years since the 2015 edition. The FDIS (Final Draft International Standard) was issued on 14 May 2026, publication as an ISO standard is scheduled for September 2026, and publication of JIS Q 9001:2026 in Japan is scheduled for December 2026. The transition period is three years from publication.
The main directions expected in the revision are as follows.
| Clause | Expected change | Implication for quality data management |
|---|---|---|
| Clause 4 (4.1 / 4.2) | Consideration of climate change has been added | Environmental elements enter the review of external and internal issues |
| Clause 5 | Quality culture and ethical behaviour are addressed in connection with leadership | Operational integrity, such as accuracy of records and prevention of falsification, is more likely to be questioned |
| Clause 6 | Clarification of how risks and opportunities are handled | Data that substantiates process risk is more likely to be requested |
| Clause 9 | Clarification of inputs to internal audit and management review | The granularity and reproducibility of the quality data presented at review become important |
Do not misread this: there is no need to rush a response right now. A three-year transition period runs from publication. Starting after the standard is published still leaves enough time.
That said, building the Link layer is not compliance work itself, it is the foundation that makes compliance easier. If clause 9 clarifies the inputs to management review, there is an enormous difference three years from now between assembling those inputs by hand every time and generating them automatically from key-joined data. Three years of transition is plenty of time to redo key design. Treating the revision as an occasion to build the foundation is a realistic way to look at it.
(Reference: Japan Quality Assurance Organisation, notice on ISO 9001 / ISO 14001 revision trends; ISO 9001:2026 explanatory site)
Factor 2: quality DX is expanding from inspection automation into factor analysis
In the manufacturing DX case analysis vol.10 published by Monodzukuri Shimbun (Publica Inc.) on 4 August 2026, 781 cases related to AI visual inspection and quality DX were analyzed.
What that showed is that quality DX has already moved beyond automation of the inspection process. The cases analyzed extend into quality data analysis, defect factor analysis, in-process quality improvement, quality assurance and traceability. By industry, the cases include sectors with heavy inspection loads such as electrical and electronics, machinery, automotive, food, and chemicals and materials.
(The breakdown ratios were not published, so no figure such as “x percent were factor analysis” is presented here.)
What this trend means is that automating inspection with AI alone is becoming harder to differentiate on. AI visual inspection is a powerful Record layer method, but if it only retains a judgement, all that has changed is that what a person used to write on a judgement sheet by eye is now recorded automatically. Only when the judgement carries an equipment ID, process conditions and a timestamp can you move on to factor analysis and say “this defect appears on machine 3 under a specific condition”.
The fact that case coverage is spreading towards factor analysis and traceability indicates that leading factories have entered the stage beyond layer 1. If your own plant has stopped at layer 1, that gap will widen.
(Reference: PR TIMES, “Monodzukuri Shimbun manufacturing DX case analysis vol.10”)
Factor 3: Thailand’s investment climate and increasingly demanding customer audits
Thailand’s investment climate has been clearly buoyant since the start of 2026. According to the Thailand Board of Investment (BOI), investment applications in the first half of 2026 reached 1.473 trillion baht across 1,299 applications, up 37% year on year. On an approval basis the figures were 1,300 approved projects and 1.0306 trillion baht, expected to create more than 82,000 jobs.
By sector, digital industries stand out at 1.115 trillion baht (90 projects), followed by electronics and electrical equipment at 120.23 billion baht (179 projects). Foreign direct investment (FDI) applications totalled 1.368 trillion baht, an 80% increase year on year.
How should these numbers be read in the context of quality data management? There are two points.
First, new entrants into the supply chain increase. New plants come online and new suppliers enter the network. For an incumbent supplier, that means more occasions on which you are compared against others.
Second, as entry increases, buyers ask for records in order to select. Customer audits increasingly include questions about how far back you can trace when a defect occurs, and how many hours it takes to produce the production conditions for a specific lot. Answering “give us three days to collect and aggregate the Excel files” in an audit leaves a very different impression from extracting it on screen there and then.
Note that the BOI does not mandate any particular method of recording quality data. The point here is purely that the competitive environment is moving towards more demanding requests for records. In sectors where IATF 16949 applies, such as automotive parts, the tendency is more pronounced. Industry-specific requirements are covered in automotive parts traceability and IATF 16949.
(Reference: Nation Thailand, “BOI investment applications H1 2026”)
Designing the linking key: four granularities and how to choose
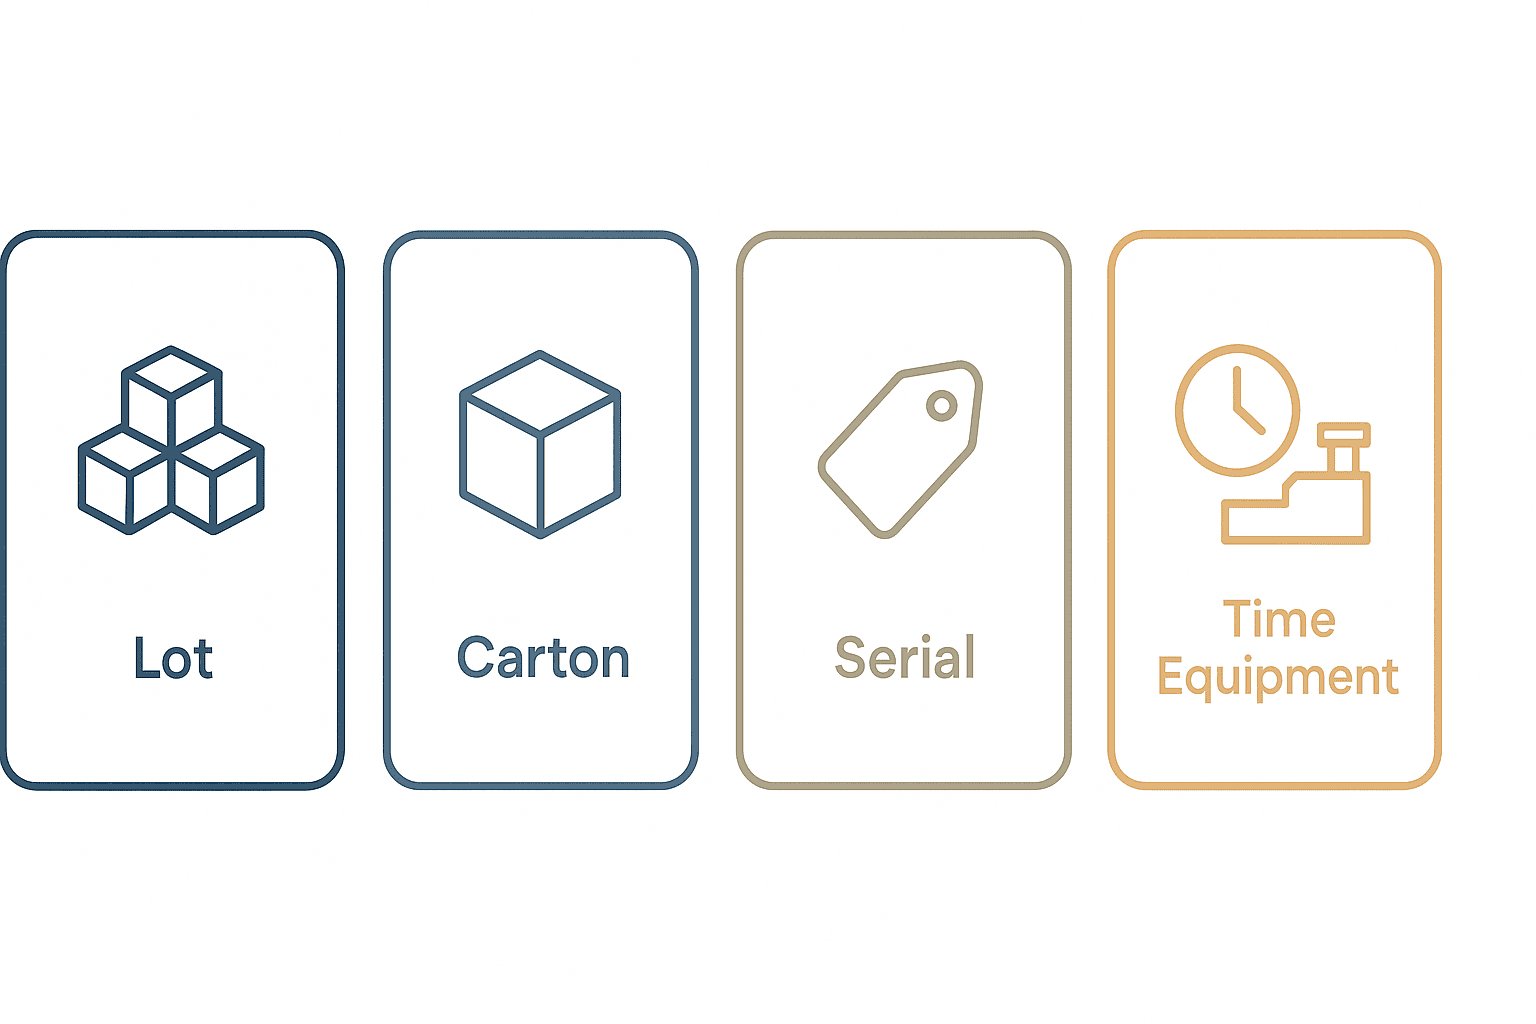
This is the centre of the article. Boil Link layer design down and it becomes a single choice of granularity: what is the one unit you will trace. In practice there are four options.
| Granularity | Unit traced | Implementation cost | Operating burden | Trace precision | Scope narrowed at recall | Suited industries and conditions |
|---|---|---|---|---|---|---|
| Lot level | Material lot or production lot | Low | Low | Coarse | The whole lot (hundreds to tens of thousands of pieces) | Chemicals, materials, food, general-purpose parts, volume production that is not high-mix low-volume |
| Carton or pallet level | Shipping carton, returnable box, pallet | Medium | Medium | Medium | The carton or pallet concerned (tens to hundreds of pieces) | Volume production of small parts, processes with clear logistics units |
| Individual serial level | Every single unit | High | Medium to high | Fine | Only the unit concerned (one piece) | Automotive parts, medical devices, electronic components, safety parts, high-value items |
| Time plus equipment level | A given machine over a given time window | Medium | Low | Medium (depends on clock accuracy) | Production within the time window | Continuous production, process industries, workpieces that are hard to mark |
Cost and precision are fundamentally a trade-off. But it is not simply a case of “go to individual serial if the budget allows”. Here is what each option looks like in practice.
Lot level: the cheapest, but it does not narrow anything
Lot level assigns a number to a material lot, or to production over a fixed period or fixed quantity, grouped together. Most factories already use some form of it.
The advantage is low implementation cost. No per-unit marking or reading is needed, and the existing lot number in the production control system can usually be used as is. There is almost no additional burden on operators.
The disadvantage is that when a problem occurs, the suspect scope is the entire lot. If one lot is 5,000 pieces, a single defect puts 5,000 pieces under suspicion. Sorting happens in both customer stock and your own stock, and per defect incident that workload is significant.
As a rule of thumb, calculate the quantity per lot multiplied by the sorting and recovery cost per piece, and ask whether that figure is acceptable. If you can absorb it happening a few times a year, lot level is enough. If a single occurrence reaches an amount that requires a management decision, a finer granularity is worth considering.
Note that even if you choose lot level, linking the lot to equipment, time and operator is mandatory. Without that you end up in pattern 1. Lot level means the smallest unit of tracing is a lot; it does not mean a lot number alone is sufficient.
Carton or pallet level: the realistic middle ground
This approach numbers shipping cartons, returnable boxes or pallets, and records which lot and which production time window the contents came from. Finer than lot level, cheaper than individual serial.
It suits small parts where marking each piece is difficult, in processes with a clear logistics unit. Screws, terminals and moulded parts, where marking individual pieces is not worth the cost or the time, but carton-level tracing is wanted.
The operational crux is label management on the cartons. When a carton is opened and the contents split, how is the number carried over to the receiving cartons? When an empty carton is reused, is the old label still on it? These two points are where the practice usually breaks down. If returnable boxes are used, it is more stable to give the box itself a permanent ID and manage by box ID combined with date and time of use.
Individual serial level: the strongest, and the heaviest to operate
This assigns a unique number to every single unit. Trace precision is the highest, and only the defective unit itself can be isolated.
It becomes effectively mandatory for safety-related parts, products where regulation requires individual tracking, and cases where the customer demands serial management. Automotive safety components and medical devices fall into this category.
Cost varies greatly with the marking and reading method. Direct part marking of 2D codes by laser, applied labels and stamping are all options, and the choice is constrained by material, geometry, and whether the workpiece sees heat or washing later in the process. On the reading side, whether a handheld reader is sufficient or a fixed reader on the line is required also changes the figure.
What is most often overlooked is what happens when a read fails. The marking is faint, it is dirty and unreadable, the reader does not respond. Does the operator type it in, set the piece aside for later handling, or stop the line? Without deciding this, units that could not be read disappear quietly from the records. Individual serial tracing assumes every single unit is reliably read, so any gap lowers the credibility of the whole dataset.
Time plus equipment level: the practical answer when marking is impossible
This works for processes where units cannot be numbered and lot boundaries are ambiguous. The scope is specified as, for example, production on machine 3 between 14:00 and 15:00 on 6 August 2026.
It is effective in continuous production and process industries, extrusion, plating, heat treatment and painting. If you collect process conditions from the equipment as a time series and also timestamp the inspection results, the two can be joined on time.
The precondition is clock accuracy. With the clock drift described in pattern 2, this method fails at the root. Recording devices across the plant must be NTP-synchronized and aligned to the second. In addition, unless dwell time between processes — the time from moulding to inspection — is stable, you cannot back-calculate production time from inspection time. Where dwell time varies widely, some intermediate identifier such as a trolley ID or batch number has to be inserted.
Collecting process conditions from equipment as a time series overlaps with machine monitoring and data collection infrastructure. If you are already gathering equipment data, it can be reused, so it is worth checking your current position against implementing factory IoT machine monitoring.
In practice, mixing granularities is normal
Four options have been laid out, but in a real factory the design almost always uses different granularities in different processes and connects them.
A typical combination looks like this.
- Material receiving: lot level (use the material lot number as is)
- Moulding and machining: time plus equipment level (collect conditions from the machine as a time series, and record the material lot charged)
- Intermediate inspection: carton level (group machined parts into cartons and link the carton ID to a time window)
- Assembly and final: individual serial level (assign a serial to the finished unit and record the carton IDs used)
- Shipping: record the individual serial and the destination
With this structure you can go from a finished unit’s serial to the carton IDs used, from the carton ID to the machining time window and machine, and from there back to the material lot charged, tracing all the way even as granularity changes along the way.
What matters is recording the parent-child relationship at every boundary where granularity changes. The record of splits and merges described in pattern 3 is what does the work here. As long as you retain that this carton holds production from this time window, and that this serialized product used parts from this carton, differing granularities can still be connected.
Put the other way round, the first thing to decide in design is not the granularity of each process so much as how the handover works at the boundaries. Draw it on one diagram and get agreement from production, quality assurance, production control and IT. That work takes one to two weeks. Nothing you can do before selecting a system has a better return.
Overall traceability design and cost are covered in building a traceability system and what it costs, which is worth reading alongside this when you are weighing granularity against overall architecture.
Designing in-process defect tracing and defect escape prevention
Once the linking key is settled, the next question is what you do with it. In practice there are two purposes: tracing back the cause of a defect that occurred, and stopping defects from flowing on to the next process or the customer.
Trace-back and trace-forward
Tracing has two directions.
Trace-back goes from a problem product backwards through its production history. You use it when a defective part comes back from the customer, or when a defect is found at final inspection. What you want to know is when, on which machine, under what conditions, by whom and from which material it was made.
Trace-forward goes from a problem material or condition outwards to the products that used it. You use it when a material lot turns out to be defective, or when an equipment abnormality is discovered after the fact. What you want to know is how far it has shipped, and which stock has to be held.
The two use the same data, but the speed required is different. Trace-back is cause investigation, so taking several hours to a day is not fatal. Trace-forward, on the other hand, feeds directly into the decision to stop shipment, so every extra hour widens the escape.
Therefore, in design terms, it is practical to use the time to complete a trace-forward as the benchmark. Build the function “enter a material lot number and get a list of the product lots that used it, together with their shipping destinations” from the very beginning. Deeper trace-back investigation can be done manually afterwards, but the first move of a trace-forward cannot be done in time without a mechanism.
| Direction | Starting point | What you want to know | Speed required | Design essentials |
|---|---|---|---|---|
| Trace-back | Defective or returned product | Process conditions, equipment, operator, material | Several hours to one day | Parent-child records that stay traceable even when the path branches |
| Trace-forward | Suspect material, equipment or time window | Affected scope, shipping destinations, stock locations | Preferably within tens of minutes | A search that produces the list in one step, and a connection to the inventory system |
Internal traceability: the joints inside the plant
As opposed to traceability across the whole supply chain, meaning external traceability, being able to trace from receiving to shipping within your own plant is called internal traceability.
The places where internal traceability breaks are fairly predictable.
- Processes that pass through stock: parts are stored after machining and drawn out later as needed, and there is no record of which lot the drawn quantity came from
- Rework and re-inspection: when a defective part is reworked back into a good part, the rework history falls outside the main record stream
- Merging of remainders: the remainder of the previous lot is mixed with a new lot and sent onward, with no record of the mixing
- Outsourced processes: plating or heat treatment is sent outside, and on return it is no longer clear which lot is which
- Shift changes and midnight rollovers: the handover record for work in progress goes missing between the end of the night shift and the start of the day shift
Check these five points against your own process flow diagram and you will usually find two or three where no record exists. Installing a system does not complete internal traceability unless you also provide operating rules and a means of recording at these five points.
Rework and remainder merging are particularly easy to overlook. A reworked part is recorded as a defect and then shipped as a good part, which makes the record internally contradictory. You need to hold the rework history in a separate table, so that both the original defect record and the post-rework inspection record can be joined by serial or lot.
Interlocks: the mindset for stopping defect escape
Tracing deals with what has already happened. Escape prevention is a mechanism that stops things before they happen, and the central idea is the interlock.
An interlock is a mechanism that does not allow progress unless a condition is satisfied. In the context of quality data management, it takes forms such as these.
| Type | Mechanism | What it stops | Implementation difficulty |
|---|---|---|---|
| Process sequence assurance | A unit without a completion record from the previous process is not accepted at the next one | Skipped processes | Medium (requires unit or carton identification) |
| Inspection completion assurance | Progress is blocked while a mandatory inspection item is unfilled | Missed inspections | Low (mandatory field control on the entry screen) |
| Judgement-linked stop | Equipment stops or alarms when NG judgements occur consecutively above a threshold | Escalation of consecutive defects | Medium (requires a connection to the equipment) |
| Process condition deviation detection | An alarm is raised, or the record flagged, when conditions leave the control range | Out-of-condition parts mixing in | Medium (assumes equipment data acquisition) |
| Pre-shipment verification | Shipping cannot be registered unless the shipping instruction and the actual carton ID match | Wrong shipments, shipment of uninspected goods | Low to medium |
There is no need to install all of them at once. The highest return comes from inspection completion assurance and pre-shipment verification. Both can be achieved on the Record layer UI and require no connection to equipment, yet they close the two largest escape routes, missed inspections and wrong shipments.
Interlocks that stop equipment automatically, on the other hand, need careful design. If the judgement threshold is too tight the line stops frequently, and the shop floor invents workarounds — an operating practice of skipping the judgement emerges. It is safer to start with raising an alarm and flagging the record rather than stopping, adjust the threshold using real data, and only then move to stopping.
Integrating with a process parameter logging system
When the cause of a defect lies on the equipment side, what you need is not only the inspection result but also the conditions the machine was running under at that moment. A process parameter logging system is a mechanism that retains conditions such as temperature, pressure, speed, torque, current and recipe number as a time series.
There are three things to decide about the integration.
First, the logging interval. Every second, every minute, or every shot (one record per shot for moulding)? Finer intervals make later analysis easier but increase data volume and cost. In practice, match it to the time scale of the phenomenon you want to see during abnormality analysis. If you need to follow something that changes in seconds, log every second; for something that changes slowly, such as furnace temperature, one minute is enough.
Second, recording of condition changes. Who changed a setpoint, and when, is as important as the value itself. The fact that the pressure setting was changed on the morning of the day defects increased will never be discovered without a change history. Always retain the event log of setting changes.
Third, the join key to inspection results. This brings us back to the theme of the article. Process conditions are recorded as time plus equipment. Inspection results are recorded by lot or by individual unit. A conversion table is required to connect the two. That table is the record saying lot L1 was produced on machine 3 between 14:00 and 15:30. Without that single record, all the process parameter data you carefully collected cannot be joined to inspection results.
It is not unusual for this conversion table to be missed in an implementation project. Equipment data collection belongs to the engineering department, inspection records belong to quality assurance, each completes its own scope, and the record connecting them ends up being nobody’s responsibility. Deciding the key design first also means making that no-man’s-land visible at the outset.
Breaking cost into five layers, and how to think about payback
When comparing quotations, splitting cost into layers in the same way as the three-layer model reveals the structure. Here we use a practical five-layer split.
The five cost layers and indicative figures in Thailand
The following are indicative ranges assuming construction in Thailand. They vary greatly with configuration, number of processes, number of target lines and the presence of existing systems, so treat them purely as a starting point for discussion. They are not a definitive quotation.
| Layer | What it includes | Indicative cost (THB) | Drivers of variation |
|---|---|---|---|
| 1. Sensor and gauge integration | Data output capability on gauges, signal acquisition from PLCs and equipment, communication gateways, visual inspection cameras | 150,000 to 1,500,000 | Number of target machines, whether existing equipment supports communication, presence of cameras |
| 2. Shop floor terminals and recording UI | Tablets and PC terminals, barcode and 2D code readers, marking devices, building the entry screens | 200,000 to 1,200,000 | Number of terminals, number of form types, scope of multilingual support |
| 3. Data platform | Servers (on-premises or cloud), database, network, backup, licences | 250,000 to 1,500,000 | On-premises versus cloud, redundancy, retention period |
| 4. Linking and master data setup (layer 2 of the three-layer model) | Design of the lot and serial scheme, cleanup of equipment, item and process masters, definitions for handover between processes, clock synchronization | 200,000 to 900,000 | Number of processes, how disordered the existing code system is, volume of cross-department coordination |
| 5. Analysis, reporting and audit response | Dashboards, stratification and process capability reports, extraction functions for audit submission, an environment for factor analysis | 200,000 to 1,200,000 | Number of report types, sophistication of analysis, number of customer-specified formats |
On top of this, annual maintenance and support typically runs at around 10 to 20% of the initial cost. If cloud is used, usage charges proportional to data volume also continue.
What this table is meant to convey is less the figures themselves than the existence of layer 4. When you collect quotations, layers 1, 2, 3 and 5 come up naturally from every vendor. They are easy to explain as functionality and countable as things. Layer 4, in contrast, tends to appear as a single line saying “to be prepared by the customer”, or not to appear at all.
Yet as this article argues, cost layer 4 – the Link layer of the three-layer model – is what decides whether the investment succeeds. A quotation with layer 4 left blank is not cheap; the part that determines success has simply been left with the buyer. That is fine if you can do it yourself, but if you build a budget without allowing for that effort, the “we have data but cannot use it” state is reproduced after go-live.
A simple payback model: estimate on four items
The payback calculation is better kept simple. Estimating annual savings from the following four items and comparing them against the initial cost is enough.
Item 1: reduction in defect cost
Faster cause identification shortens the period over which defects are produced. The formula is as follows.
Annual saving = loss per defect incident x incidents per year x reduction rate of the occurrence period
Here the reduction rate of the occurrence period is how much the number of days spent identifying the cause shrinks. If identification that averaged five days becomes two days, the defects that would have been produced over those three days are avoided. Note that no guarantee such as “defects will halve” can be made. Whether a countermeasure works is a separate question from whether the cause is identified. Keep this figure conservative in the estimate.
Item 2: reduction in sorting effort
Finer linking granularity narrows the suspect scope.
Annual saving = (current quantity to be sorted – quantity after narrowing) x sorting time per piece x labour rate x occurrences per year
This connects directly to the four-granularity comparison table. If 5,000 pieces sorted at lot level becomes 500 pieces at carton level, that is one tenth. This item is easy to quantify and works well as the justification for investing in finer granularity.
Item 3: reduction in complaint response effort
This is the effort of preparing answers to customer enquiries.
Annual saving = reduction in preparation time per case x complaints per year x labour rate
Hunting for records and aggregating them becomes a matter of searching by key and exporting. A change from half a day per case to 30 minutes is within the realistic range. The more cases you handle, the more this matters.
Item 4: reduction in audit preparation effort
This covers internal audits, customer audits and certification audits.
Annual saving = reduction in preparation effort per audit x audits per year x labour rate
Audit preparation is largely collecting the requested records and binding them. If they can be exported from key-joined data, that work drops substantially. Count how many audits you actually receive per year and this often turns out to be a larger item than expected.
How to use the estimate
Take the annual saving across the four items and see how many years it takes to recover the initial cost. For shop floor systems in manufacturing, a payback of two to four years generally passes an investment decision — that is the broad sense of the norm.
There are, however, two sources of value that do not enter this calculation.
One is the effect of lowering the ceiling on damage when a major quality problem occurs. The loss from recalling a wide scope because you could not trace is an order of magnitude away from routine savings. It has the character of insurance, hard to compute as an expected value, but not something management can ignore.
The other is customer evaluation. A factory that can produce data on the spot during an audit and one that cannot may see a difference in the next order opportunity. It cannot be quantified, but it is worth having sales and quality share the same understanding of it.

Making quality data management stick in a Thai factory
Once design and cost are settled, the next question is adoption. Japanese-owned factories in Thailand face several specific issues. They are operational rather than technical, which is exactly why they get missed in system selection discussions.
Issue 1: unifying terminology across Japanese, English and Thai
Quality records are frequently handled in three languages. Japanese managers work in Japanese, Thai staff work in Thai, and reporting to customers and head office is in English. What causes trouble here is the correspondence between defect mode names.
How do you express dent, burr, warpage, chipping, foreign matter and discolouration in Thai and in English? When translations emerge spontaneously on the shop floor, the same phenomenon acquires several names, or conversely different phenomena get grouped under one name.
The countermeasure is to place the code system above language. Assign each defect mode a code such as D-012, and manage the display name in each language as an attribute of that code. What is stored in the database is the code; only the screen display switches by language. This way, records entered in Thai can still be aggregated in Japanese.
In practice, building this defect mode code table takes several days to one or two weeks. You have to collect the names actually used on the floor, consolidate and prune them, and settle the display name in three languages. It is unglamorous work, but skip it and the Analyze layer will not function.
| Target | Should it be coded | Reason |
|---|---|---|
| Defect mode | Mandatory | It is the axis of stratification and Pareto. Naming drift destroys analysis |
| Process | Mandatory | It is the key for handover records between processes |
| Equipment | Mandatory | Machine names frequently differ between departments |
| Item | Mandatory | Organize this together with the mapping between customer part numbers and internal part numbers |
| Cause classification | Recommended | Used for trend analysis of corrective actions |
| Operator | Mandatory | Manage by employee ID. Spelling of names can change |
Issue 2: getting local staff to sustain the recording practice
The quality of records depends on the understanding of the person entering them. If people enter data without knowing why a field exists, it gets skipped when they are busy, or filled with an arbitrary value.
Here are several measures that work well in Thai factories.
- Reduce the number of fields: keep only what is genuinely needed. Cut anything that is merely nice to have. The more fields there are, the lower the quality
- Use selection instead of free text: avoid free entry and have people choose from coded options. This also prevents naming drift at the same time
- Return a result on the spot: feedback such as seeing your own team’s defect rate for the day after entering data conveys the meaning of the entry
- Explain it to the leader level: rather than explaining the reasoning to everyone, it spreads better if line leaders and supervisors understand what the data reveals
- Build the screens in Thai: do not make people put up with English. Language-driven entry errors are common
Returning a result on the spot is particularly effective. If the data entered never comes back to the people entering it, recording becomes a task performed for someone upstairs. Simply making the day’s results visible turns the record into a tool the team owns.
Issue 3: designing training on the assumption of turnover
A certain amount of turnover occurs on Thai production floors. Even if you train everybody at go-live, a year later people who never received that training are entering data.
Training therefore has to be designed as a mechanism rather than an event.
- Turn the operating procedure into one illustrated page per screen and keep it next to the terminal (paper is fine)
- Define, as a role, who teaches a newcomer when one arrives (make it the line leader’s role, not quality assurance’s)
- Treat the Thai version of the procedure as authoritative, with the Japanese version as its translation
- Whenever a system update changes a screen, update the procedure at the same time without exception
Factories where the operating procedure exists only in Japanese, or has not been updated, are not unusual. It is worth putting “Thai procedure documents created, and an owner assigned for updates” into the completion criteria of the implementation project.
Issue 4: customer audits and IATF compliance
Japanese-owned automotive parts plants have IATF 16949 to deal with. From a quality data management perspective, the points most likely to be questioned are these.
- Can you present the production record, inspection record, materials used, equipment and operator for a specific product or lot
- Are you meeting the record retention period (the number of years differs by customer requirement)
- Can you demonstrate that records have not been altered (are the entrant, entry timestamp and revision history retained)
- Are corrective action records for a non-conformance connected to the lot concerned
- Are calibration records for measuring instruments connected to the data measured with those instruments
That last one, linking calibration records, is easy to overlook. If you cannot answer which instrument a measurement was taken with, and whether that instrument was within its calibration period at the time, the credibility of all measurement data from that period comes into question. Measuring instruments should also be given IDs and included in the records.
For audit response in detail and requirements specific to the automotive industry, see automotive parts traceability and IATF 16949.
Issue 5: designing the period where paper and digital coexist
Realistically, you cannot switch entirely to digital on a given date. A coexistence period occurs. The problem is that unless you design coexistence as a temporary transitional state, it becomes permanent.
There are three things to decide about the coexistence period.
Which one is authoritative. When the same information exists on both paper and screen, state explicitly which is the official record. If both are official, you cannot decide anything when they disagree.
Until when. Set a deadline. Fix a concrete date, such as line A stops using paper in three months. Without one, writing on paper survives as a habit.
How to avoid double entry. A practice of writing on paper and then typing into a terminal does not last. It doubles the operator’s burden, and one of the two becomes a formality. If they must coexist, it is realistic to limit paper to a backup for when the terminal is unavailable, and use the terminal only in normal operation.
The transition away from paper itself is covered process by process in how to move from paper forms to a paperless factory.
A 90-day roadmap
Here is everything above reduced to an order you can actually execute. The assumption is a factory that has some Record layer in place but no Link layer. If you are starting from nothing at all, a period for considering the Record layer is needed before Day 0-30.
| Period | Main activities | Deliverables | Departments involved | Where it stumbles |
|---|---|---|---|---|
| Day 0-30 | Current-state assessment and key design | Process flow diagram, inventory of where data currently sits, decision on granularity, draft code system | Quality assurance, production, production control, IT | Discovering that lot definitions differ between departments, and coordination taking time |
| Day 31-60 | Small-scale implementation and a one-line trial | Working recording and linking on one line, defect mode code table (three languages), procedure documents | Quality assurance, production (target line), IT, vendor | Exception handling (rework, remainders, read failures) not yet defined |
| Day 61-90 | Building the analysis outputs and preparing rollout | Dashboards, extraction function for audits, trace-forward search, rollout plan | Quality assurance, management, production | Building too many analysis screens, so that nobody looks at most of them |
Day 0-30: decide everything while it can still be written on paper
Most of what you do in these 30 days does not involve touching a system.
- Draw the process flow on one sheet: from receiving to shipping, including all inter-process stock, splits and merges
- Inventory where data currently sits: list which record lives where (paper, Excel, a system, inside the equipment)
- Decide the granularity of each process: choose which of the four granularities applies process by process
- Decide the handover at the boundaries where granularity changes: this is the most important item. The mapping between carton ID and serial, between time and lot, and so on
- Draft the code system: assignment rules for equipment, process, defect mode and item codes
- Decide the clock synchronization policy: NTP server, time zone, record format
The deliverables are diagrams and tables, not a system. Because this gives you a document set to show vendors, quotation accuracy improves as well.
Where it stumbles is the discovery that lot definitions do not match. Each department will insist that this is how they have always done it. Forcing unification here stalls the project, so it helps to signal early that the approach is to solve it with parent-child records rather than unification.
Day 31-60: run one line end to end
Pick one target line and run recording and linking end to end, from receiving to shipping. Do not roll out to all lines at once.
- Criterion for selecting the target line: choose a cooperative line, not the line with the most problems. The first objective is to validate the mechanism, not to produce results
- Finalize the defect mode code table in three languages
- Build the entry screens in Thai and have actual operators use them
- Define exception handling: reworked parts, remainders, read failures, records while equipment is down
- Produce the Thai operating procedure
Where it stumbles is exception handling. The normal path works as designed, but the floor stops when rework or a read failure occurs. It helps to assume that half the purpose of a one-line trial is to surface the exceptions.
Day 61-90: build the outputs and decide on rollout
Once linked data has accumulated, build the Analyze layer.
- Stratification dashboard: a screen showing defects by machine, by shift, by product type and by defect mode
- Trace-forward search: a screen where entering a material lot or time window returns the affected scope
- Audit extraction: a function where entering a lot or serial produces the full set of production records
- Rollout plan: the order of deployment to the remaining lines, terminals required, additional cost
Where it stumbles is building too many analysis screens. Add screens because they might be useful and you will end up with only one or two that are actually looked at daily. Limiting yourself to three screens at first is realistic. Write down, for each screen, who looks at it, when, and to decide what, before building it.
What you have at the end of 90 days is not a completed system but the evidence on which to decide about rollout. You confirm that one line works, that exception handling holds, and that the analysis is genuinely usable, and then decide whether to extend to the rest. Following that order ends up being faster than installing every line at once from the start.
A ten-point implementation checklist
These are set at a level you can check today. Any item you cannot answer yes to immediately is where you should start.
- Can you identify the production machine from an inspection record? Pull one actual record and check whether an equipment ID exists in either the inspection record or the lot record
- Are the clocks aligned on the devices that keep records? Compare the equipment PC, the tablet and the server right now, and check that the gap is under one minute
- Can you explain the lot definition of each process? Check whether production, quality assurance and production control give the same explanation of what constitutes one lot in each process
- Are splits and merges between processes recorded? Try tracing back on paper from a finished-goods lot to the material lots used
- Are defect mode names consistent? Extract defect mode names from the last three months of records and check for different spellings of the same phenomenon
- Do departments use the same names for equipment? Check whether the production floor name, the maintenance asset number and the system ID agree
- Is the history of reworked parts retained? For a product that was reworked and shipped, check whether the original defect and the rework content can be traced afterwards
- Are measuring instruments linked to measurement data? For a given measured value, check whether you can show the instrument used and its calibration status at the time
- How many minutes does a trace-forward take? Ask someone to produce the shipping destinations of products that used a given material lot, and measure how long it actually takes
- Is the Thai operating procedure current? Check on the floor whether the screens in use match the content of the procedure
Item 9 in particular is worth doing. Timing it with a stopwatch makes the gap between assumption and reality plain. If it takes several hours, that is exactly the time it will take during a customer audit or an actual recall.
Frequently asked questions
What is the difference between a quality data management system and an electronic forms system?
An electronic forms system is a Record layer method in the terms of this article. Its role is to replace paper checksheets and inspection certificates with on-screen entry and retain the record digitally.
A quality data management system refers to the whole, meaning those records plus linking (layer 2) and analysis (layer 3). So the relationship is that electronic forms are one part of quality data management.
The practical caution is that some electronic forms products have linking capability and some do not. A statement that forms can be digitized tells you nothing about whether the record can be linked to a lot or a machine. When evaluating a product, always ask what this record can be joined to afterwards.
Where should digitization of quality records start?
The standard answer is to start with records that involve transcription. Where something is written on paper and then retyped into Excel by somebody, the benefit of digitization converts directly into reduced effort.
The next priority is records that customers and auditors frequently ask for. Search time and binding time drop, and if linking is in place, audit response becomes far easier.
What can wait, conversely, are forms that are recorded but nobody reads. In that case it is better to first ask whether that record is genuinely needed. A digitization project is also an opportunity to take stock of the forms themselves.
Whichever record you start with, the order does not change: decide the linking key first. Adding a key after digitization is more expensive, because it requires retroactive correction of existing data.
Do you need AI to identify defect causes?
The practical answer is that it depends on the stage.
For most factories, stratification is enough to begin with. Simply splitting defects by machine, by shift, by product type and by time window often makes a bias visible. Concentrated on machine 3, concentrated on the night shift, concentrated on a particular material lot. None of this requires statistical techniques.
AI and machine learning become useful for defects that arise from a combination of several conditions and are invisible to simple stratification. Cases that only occur when temperature exceeds a threshold and humidity also exceeds a threshold, for example. Machine learning based defect factor analysis commonly integrates data from equipment sensors, quality inspection and production results, learns patterns and narrows down contributing factors, and is used in combination with real-time visualization on a BI dashboard.
The precondition, however, is data that can be integrated. If equipment data and inspection results are not linked, there is no dataset to train on. In this sense too, considering AI comes after the Link layer is built. Reverse the order and you end up with an expensive tool and nothing to feed it.
How much does implementation cost?
As the cost table shows, the total across five layers has a wide range depending on configuration. Here we simply restate how to think about the ballpark.
Starting from one line with a limited scope and building several lines at once differ by an order of magnitude in cost. Also, if an existing production control system already provides a foundation for lot management, the burden of layer 4 becomes lighter, whereas a disordered code system can make layer 4 the largest line item of all.
If cost is a constraint, the realistic approach is to start small with one line as the 90-day roadmap describes. The Day 0-30 key design can be carried out with your own staff, so no significant spending occurs at that stage. Getting quotations after the design is fixed also narrows the spread of the figures, because the scope is clear.
The overall cost structure of traceability is also organized in building a traceability system and what it costs, which is worth reading while you are forming a budget picture.
How does this help with submitting records for customer audits?
It helps in three ways.
First, the time to submission drops. When you are asked during an audit to produce the records for a given lot, the difference is between extracting it on screen and submitting it at a later date.
Second, you can demonstrate consistency of records. Collecting paper and Excel for submission makes uneven formats and granularity conspicuous. Exporting from data joined on a single key naturally conveys that the record system is organized.
Third, you can explain the scope of tracing. Asked how far you can narrow things down when a defect is found, you can answer by showing the granularity design. A factory that can explain whether it works at lot level or unit level, and why that granularity was chosen, tends to be evaluated as a factory with a deliberate record design.
Conversely, without linking, none of these three is possible. That is why building the Record layer alone rarely improves audit evaluation.
Will this create duplicate management alongside the existing production control system?
It easily can, so the division of responsibility has to be decided during design.
The general arrangement is as follows.
| Data | Where it primarily lives | Reason |
|---|---|---|
| Item master, process master, BOM | Production control system | Managed together with orders, planning and costing |
| Production plan, instructions, output quantities | Production control system | The core of the planning side |
| Lot number assignment | Production control system (recommended) | It is used on both the planning and the results side |
| Inspection results, measured values | Quality data management side | Many fields, and a high update frequency |
| Process condition time series | Quality data management side or the data platform | Large data volume, poorly suited to production control |
| Non-conformance and corrective action records | Quality data management side | You want to join them to inspection results on the same key |
The essential point is to keep master data and lot number assignment on the production control side, and have the quality side reference them. If the quality side assigns its own lot numbers, duplicate management starts there.
In a factory that already has a production control system, first check how much that system already holds about lot, equipment and time. If machine numbers are being captured in production result entry, half the Link layer already exists. There is no need to build from zero.
Conclusion
A quality data management system consists of three layers: the Record layer, the Link layer and the Analyze layer. Most factories install only the Record layer and stop, arriving at the state where the data exists but the cause of a defect cannot be identified. The cause is not a failure of product selection. It is that recording began before the linking key was decided.
Here are the main points of this article.
- The Link layer is the substance. The key design that ties recorded values to a time, a lot or unit, a machine, an operator and a set of process conditions is what decides whether the investment succeeds
- The five typical patterns behind unidentifiable causes are all failures of linking, not of recording: missing equipment ID, clock drift, mismatched lot definitions between processes, fragmented Excel, and non-conformance records kept separately
- There are four granularities: lot level, carton or pallet level, individual serial level, and time plus equipment level. Choose on the trade-off between cost and the scope you can narrow to, and in practice mix them by process. What matters decisively is the handover at the boundaries where granularity changes
- Design escape prevention with interlocks. Start with the two that require no equipment connection: inspection completion assurance and pre-shipment verification
- Break cost into five layers: 1. sensor and gauge integration, 2. shop floor terminals and recording UI, 3. data platform, 4. linking and master data setup, 5. analysis, reporting and audit response. If layer 4 is blank in a quotation, it is not cheap; the part that determines success has been left with you
- Estimate payback on four items: defect cost, sorting effort, complaint response effort and audit preparation effort. Sorting effort in particular connects directly to the choice of granularity and is easy to quantify
- Adoption in Thailand is an operational problem. Unify three-language terminology through a code system, cut the number of entry fields, and return a result on the spot. Assume turnover, and assign owners for procedures and training
- Work in 90 days. In the first 30 days touch no system and settle the process flow, granularity, code system and clock synchronization on paper. Use the next 30 for a one-line trial, and the last 30 for analysis outputs and the rollout decision
On the external side there is the ISO 9001 revision (ISO publication scheduled for September 2026, JIS Q 9001:2026 scheduled for December 2026, three-year transition), the movement of quality DX from inspection automation towards factor analysis and traceability, and the tightening of customer audits that accompanies Thailand’s investment boom. None of these is urgent, but given that building the Link layer takes several months, starting the design now is a reasonable move.
One last time: decide the linking key before you select a product. That is the whole of this article.
Designing the linking key can begin before any system contract, simply by laying your process flow diagram next to the records you keep today. In Thailand, TOMAS TECH has worked through the Record, Link and Analyze layers on real production processes, building shop floor systems including the PEGASUS production and energy management system. If you only want to talk through design-stage questions, such as which granularity fits your operation or how far your existing production control system can be reused, that is entirely fine, and it is no problem at all if you are still at the very beginning of your consideration. We will listen to the situation on your processes and lay out the options for how to proceed. You are welcome to get in touch through our contact form.


