


“The machine runs fine. It just doesn’t give us any data.” You hear this on factory floors across Thailand. A machining centre relocated from Japan twenty years ago, a press bought second-hand locally, an older assembly unit with no communication port at all. The equipment is running, but how many hours it ran and how many hours it sat idle exists only in a handwritten daily report. Legacy equipment IoT is the practical way to change that without replacing the machine. This article uses a Japanese-owned parts maker in the Amata Nakorn Industrial Estate in Thailand, with 30 machines, as a model, and works through the cost broken into five layers, the annual benefit and payback, and the local factors that trip projects up here.
Why legacy equipment IoT matters right now – the numbers Thai manufacturing is facing
Start with the numbers that frame the decision. According to Thailand’s Ministry of Industry, the Manufacturing Production Index (MPI) for June 2026 fell 3.10% year on year, and the second quarter of 2026 was down 1.79%. Average capacity utilisation for that quarter was 57.47%.
How you read that 57.47% matters. It is not a share of machines. It means that more than 40% of installed capacity, the remaining 42.53%, is left unused against plan. In a period when output is flat, building a new line exposes that new line to the same low utilisation. Investment that lifts the utilisation of equipment you already own, by even a few points, is what pays off first when demand returns.
Look at the investment side as well. The Thailand Board of Investment (BOI) reports that applications in the first half of 2026 reached 1,299 projects worth THB 1.47 trillion (approximately USD 43.6 billion), up 37% year on year. Of these, 132 projects worth THB 17.2 billion (approximately USD 507.6 million) came under the Smart and Sustainable Industry measure. That measure covers machinery upgrades, adoption of digital technology, and automation and robotics integration. In other words, separate from the conversation about building new plants, there is an institutional channel for investment that makes the plant you already have smarter.
Industry media abroad have put the picture this way. Brownfield plants that keep their existing equipment tend to land in an OEE (Overall Equipment Effectiveness) range of roughly 50% to 75%. That is reported to fall short of greenfield plants at 75% to 85%, but still to reach at least the level of the industry average, which is given as 55% to 65%. This is not an argument that you should give up because you cannot beat a new build. It is a question of how far you can realistically push, at an investment level that is one or two orders of magnitude smaller.
On the definition of OEE and how it decomposes into availability, performance and quality rate, Omron has a clear explainer (see References at the end of this article; it is written in Japanese). When you want to push an IoT project past “we can see it now” and into actual KPIs, that decomposition gives everyone a shared language.
Translated into shop-floor terms, it looks like this. Replacing a single machine runs into millions of baht; replacing a whole line changes the order of magnitude again. Retrofit IoT, where you attach sensors to existing equipment and start logging uptime, can begin at around THB 40,000 per machine if you count only the device and the installation work. Include the shared costs that do not scale with machine count, the survey, the visualisation platform and the training, and the Phase 1 total works out at THB 111,800 per machine. Either way it stays an order of magnitude below replacing the machine, so the approval hurdle differs, and so does the damage if it does not work out.
What retrofit IoT is – how it differs from a new build, and the three places data comes out
Retrofit IoT means attaching external sensors and communication devices to equipment after the fact, to capture operating data without replacing the equipment itself. The term is sometimes used loosely. It can refer to mechanical modernisation, such as replacing drives or control panels, and it can refer purely to data capture. It is worth aligning on the definition inside your own organisation before the discussion starts. This article deals with the second meaning, that is, the scope where the machine’s behaviour is untouched and only the data is brought out.
The biggest difference from a new build is that the specification is not in your hands. On a new line you can say “procure it with the capability to output this data.” On existing equipment you have to start by finding out what can be extracted from each machine at all. That is why the Layer 1 survey cost exists.
In practice, the places data comes out can be grouped into three.
1. Tapping the stack light
This method clamps a voltage-sensing tap onto the wiring of the green, amber and red stack light on top of the machine. Stack light data collection is the easiest entry point into legacy equipment IoT.
It has three advantages. First, it is the cheapest option. Second, because it does not touch the machine’s control circuit, it is easier to explain the impact on the manufacturer’s warranty. Third, the wiring work is short, and in many cases it can be done during a lunch break or a changeover window. Work on live wiring is avoided for safety, so this is not literally zero downtime; more on that below.
The disadvantage is that the information is limited to three states, running, stopped, and alarm. It will not tell you why the machine stopped, at which process step it stopped, or what the cutting conditions were. That said, in many plants even “how many hours are we stopped” has never been turned into a number, and those three states alone can change decisions.
There is one more practical trap. The rules governing the stack light differ from machine to machine. On one machine amber means “changeover in progress”; on another it means “material running low.” Unless you build a colour-to-meaning mapping table for each machine, the aggregated data will not mean the same thing across the plant. Building that table is one of the main tasks in the survey stage, Layer 1.
2. Reading from outside with current, vibration and temperature sensors
This method clamps a CT (current sensor) onto the power line inside the control cabinet, or attaches vibration and temperature sensors to motors and bearings. It infers machine state from physical phenomena without touching the control system at all.
The advantage is that you get load trends. A current waveform gives you a basis for judging whether the machine is cutting or idling, and whether load is creeping up as tooling wears. If you capture vibration and temperature trends continuously, it becomes possible to pick up early indications of a sudden failure. We cover how early detection works and how to set thresholds separately in our article on predictive maintenance systems.
The disadvantage is that it involves opening the control cabinet. Fitting a CT to a power line requires work inside the panel, which as a rule is done with the machine stopped and the power isolated. Needing a shutdown window means needing coordination with the production plan. Also, reading “what the machine is doing” from a current value requires accumulating normal-condition data for a period first, so that you have a baseline. Meaningful anomaly detection does not start the day after installation.
3. Reading from the PLC or a serial port (Modbus and OPC UA)
This method reads data directly from the machine’s controller (PLC) over a communication protocol. Among Ethernet-capable PLCs, models with a built-in OPC UA server can be read via OPC UA, while models without one may be readable via EtherNet/IP or a vendor-specific protocol. On older models, if there is an RS-232C or RS-485 serial port, it may be possible to read them via Modbus RTU. Industry media report that going through open protocols such as Modbus and OPC UA allows even previous-generation PLCs to be connected to a modern monitoring platform.
The advantage is that it carries by far the most information of the three. You may be able to obtain production counts, alarm codes, setpoints, cycle times, and even process step numbers. If you want to tie data to quality records and trace at lot level, this route is the prerequisite. For the overall design of linking process data to product lots, reading our article on the cost of building a traceability system alongside this one makes it easier to draw the line on how much to include in Phase 1.
There are three disadvantages. First, it is highly model-dependent, and the up-front survey takes time. In many cases the address map documentation, meaning which register holds which value, is no longer on site, and you have to go back to the equipment manufacturer. Second, if the work requires modifying the PLC program, it may conflict with the manufacturer’s warranty conditions. Third, you need to confirm in advance that adding communication traffic will not affect the existing control cycle.
Comparing the three extraction points
| Extraction point | Cost per machine | Machine stoppage required | Data you can get | Equipment it suits |
|---|---|---|---|---|
| 1. Stack light tap | Low (device THB 18,000) | Largely not required (short wiring window only) | Three states of running, stopped and alarm, plus stop duration and stop count | Older machines with no communication port, machines where you first want the overall picture |
| 2. Current and vibration sensors | Medium to high (device THB 35,000) | Required (panel work means a shutdown) | Load trends, distinguishing idling from cutting, early signs of degradation | Bottleneck machines, machines that fail often, mainly motor-driven equipment |
| 3. PLC and serial connection | Medium (connection device THB 25,000, though the up-front survey effort is heavy) | Depends on the situation (short stop for wiring and configuration) | Production counts, alarm codes, cycle times, setpoints | Machines you want to link to quality data, relatively newer machines |
All three are Layer 2 device unit prices and exclude the Layer 3 installation work, which is THB 22,000 per machine. Adding the installation cost, the total per machine comes to THB 40,000 for a stack light tap, THB 47,000 for a PLC connection and THB 57,000 for a current sensor, in that order.
These unit prices come from the model estimate used in this article. They move up or down with the age of the machine, the condition inside the panel, and any additional parts required.

In practice you mix all three across the fleet. Running a PLC connection on all 30 machines is unrealistic on both cost and schedule, while covering every machine with a stack light tap alone leaves you unable to analyse root causes on the bottleneck machines.
Working out which category your equipment falls into – a 30-minute inventory
There is work you can do in-house before you ever request a quotation, and that is building an equipment register in a single spreadsheet. At a scale of 30 machines, you can put the skeleton together in 30 minutes to an hour while walking the floor.
Eight columns are enough.
- Machine name and asset number – include the name the floor actually uses. It is not unusual for “Machine 3” and the model designation in the register to fail to match.
- Year installed and manufacturer – the year matters for warranty conditions and parts availability.
- Type of controller – PLC manufacturer and model. Photographing the nameplate makes the later survey much faster.
- Presence of communication ports – open the cabinet door and look for a LAN port or a serial port such as a 9-pin D-sub. If there is one, photograph it along with the part number.
- Stack light and its lighting rules – confirm the meaning of each colour with the maintenance staff.
- Free space inside the panel – is there roughly 10 cm of free width on the DIN rail? If it is full, you incur an additional cost for mounting a small box outside the panel.
- Whether power can be taken – is there a spare 24 V DC or single-phase AC terminal inside the panel?
- Perceived monthly downtime – ask maintenance and production separately, and the numbers will often diverge. That divergence is itself supporting evidence for why visibility is needed.
For the model plant, the inventory came out as follows. Of the 30 machines, 10 have Ethernet-capable PLCs, 8 have serial communication only, and 12 have nothing but a stack light.
How to set priorities
Once the register exists, narrow down the Phase 1 scope. There are three criteria.
Criterion 1, is it a bottleneck? If you leave out the machine that sets line throughput, visibility will not translate into action. Put the other way round, cutting downtime on a machine that is not the bottleneck will not increase plant output. This connects directly to the discussion of the conversion rate to extra production later in this article.
Criterion 2, does it stop often? Data only creates value where there is variation. Monitoring a machine that stops once a year yields little information.
Criterion 3, how hard is extraction? Where the expected benefit is comparable, start with the machine that needs the lighter installation work. Putting the difficult machines into Phase 1 tends to stretch the schedule there and delay everything else.
Using those three criteria, the model plant selected 10 machines for Phase 1, made up of 6 stack light taps, 2 current sensors and 2 direct PLC connections. The 6 stack light taps provide breadth, turning total downtime into a number, while the 2 current sensors and 2 PLC connections provide depth, digging into root causes on the bottleneck machines.
The five cost layers of legacy equipment IoT – a model estimate for 10 machines in Phase 1 at a 30-machine Thai plant
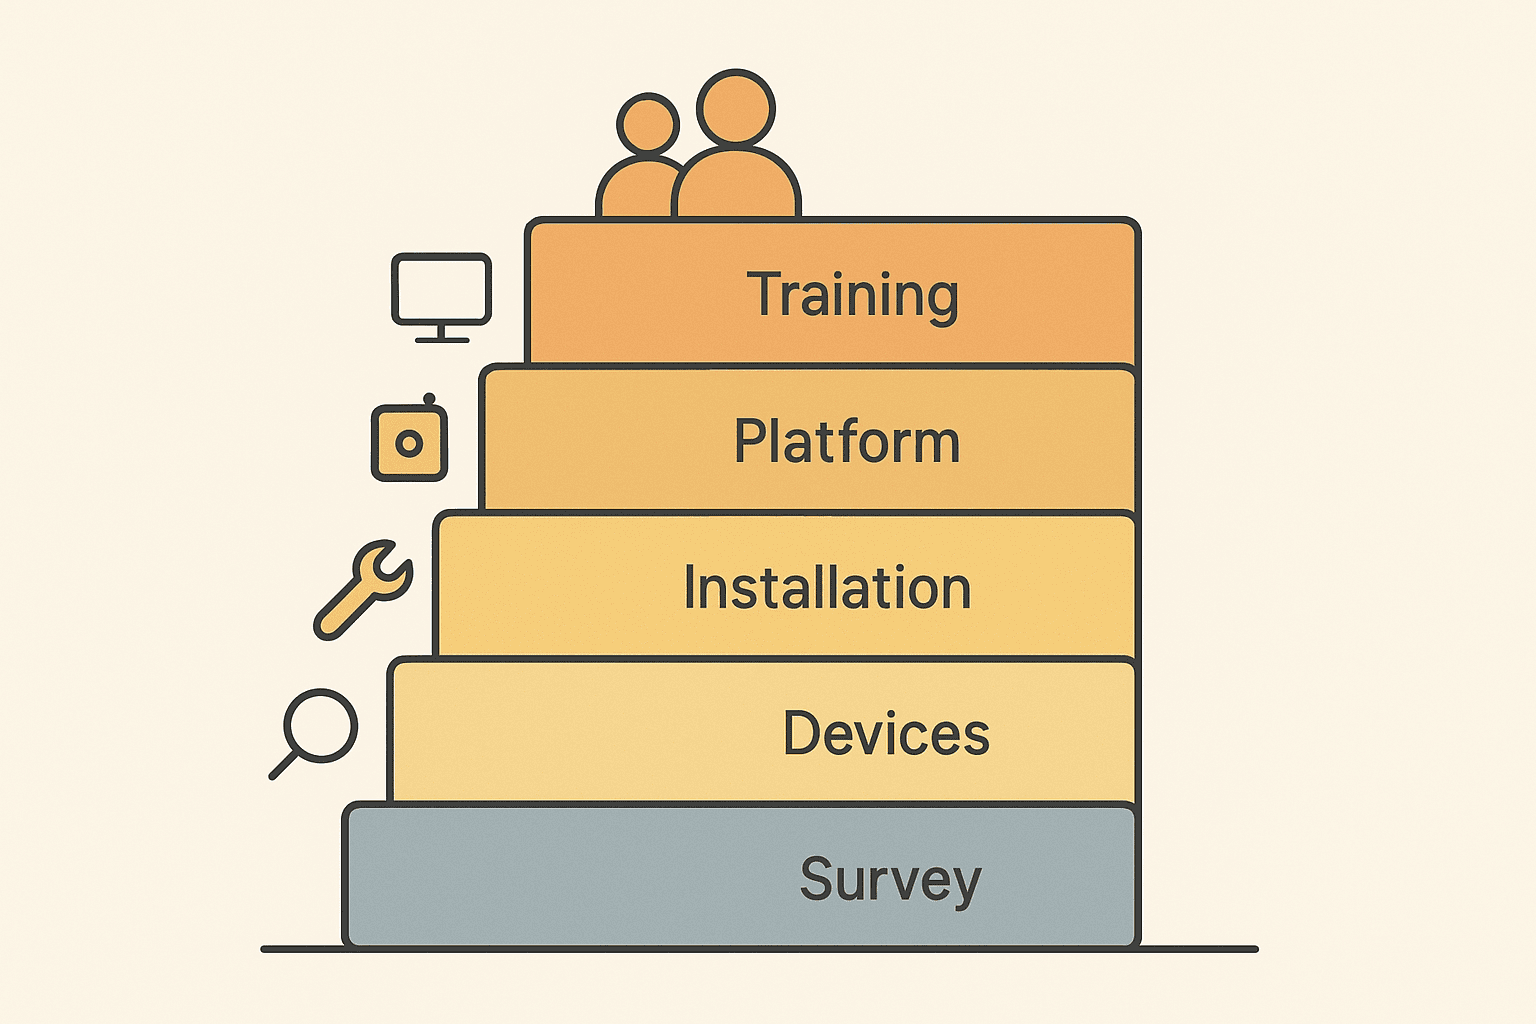
Retrofit IoT quotations are hard to read because several costs of very different character arrive on a single sheet of paper. Break them into five layers and it becomes visible which ones move with your own conditions. The following is the initial cost for the model plant, Phase 1, 10 machines, in THB.
| Layer | Contents | Amount |
|---|---|---|
| Layer 1 | Site survey and requirements definition (equipment interface survey, panel space, power, RF environment) | 180,000 |
| Layer 2 | Sensors and edge devices | 318,000 |
| Layer 3 | Electrical work and installation (in-panel wiring, CT fitting, shutdown coordination) | 220,000 |
| Layer 4 | Software and visualisation platform (cloud, dashboards, initial setup of links to existing systems) | 260,000 |
| Layer 5 | Training and adoption support (floor training, KPI definition, two months of hands-on support) | 140,000 |
| Total | 1,118,000 |
The initial total is THB 1,118,000, or approximately JPY 4.9 million (converted at roughly JPY 4.4 to the baht; treat this as indicative, since exchange rates move).
What moves the amount in each layer
Layer 1, site survey and requirements definition, THB 180,000
This moves with the number of target machines and how much documentation survives. If the manufacturer’s drawings and communication specifications are still held on site, the survey is shorter. On machines that have been relocated or bought second-hand, drawings have often been lost, and the survey becomes a matter of opening the panel and measuring. Cutting this layer tends to produce a later “it was not what we expected once we opened it up,” which comes back as an extra charge in Layer 3. When you compare quotations, be wary of a proposal in which this layer looks too thin.
Layer 2, sensors and edge devices, THB 318,000
The breakdown is as follows. Stack light taps, 6 units at 18,000 = 108,000. Current sensors, 2 units at 35,000 = 70,000. PLC connections, 2 units at 25,000 = 50,000. Edge gateways, 2 units at 45,000 = 90,000. That comes to THB 318,000.
The item most often overlooked here is the edge gateway. The quantity is determined not only by sensor count but by the physical layout of the machines. The model plant uses a configuration in which 2 gateways cover the 10 machines, but if the equipment is scattered across separate buildings, the number goes up. When you compare quotations, check how many machines each proposal assumes one gateway will serve.
Layer 3, electrical work and installation, THB 220,000
That is 10 machines at 22,000 = THB 220,000. This is the layer that swings most with local conditions. An extension box where there is no free space in the panel, tracing work where no as-built wiring diagram exists, scaffolding where work at height is required, and premiums for weekend or night work driven by shutdown coordination. All of these can be anticipated to some degree at the inventory stage. Conversely, a quotation obtained without doing that inventory is safer to treat as still carrying significant assumption risk in this layer.
Layer 4, software and visualisation platform, THB 260,000
This covers building the cloud environment, designing and creating the dashboards, and the initial setup of links to existing systems such as a production management system or ERP. This layer does not scale much with machine count; it does not change greatly between 10 machines and 30. That is precisely why the per-machine burden becomes heavy in the 3-machine PoC discussed below.
What moves the amount is the depth of integration with existing systems. Viewing on a dashboard alone stays light, but writing production results back into an existing production management system requires surveying and validating the interface specification on the other side. Draw the line on how far Phase 1 goes at the very beginning.
Layer 5, training and adoption support, THB 140,000
This covers floor training, KPI definition, and two months of hands-on support. Deciding to cut this layer out of a quotation is the easiest saving to make on paper and the most expensive one in outcome. Data can be flowing, but if there is no one looking at it and no forum in which decisions get made, the benefit simply stays at zero. In Thai plants you need training materials in Thai and a design that brings local key people in, so it is realistic to allow more for this layer than you would on a comparable project in Japan.
Running costs
Separate from the initial cost, there is an annual running cost. Cloud and connectivity for 10 machines at THB 9,500 per month x 12 = THB 114,000, plus maintenance and sensor calibration at THB 46,000. Together that is THB 160,000 per year.
Sensor calibration cost is conspicuously often left out of estimates. Both current sensors and vibration sensors drift over time. If you keep running trend monitoring on drifted values, the judgements themselves go wrong. Build annual calibration into the operating routine.
Benefit and payback – the one variable that turns 3.3 years into 2.3 years or 7.2 years
The benefit is built up from three items. What matters is that the three do not overlap in scope. Counting the same saving under two headings inflates the benefit on paper but does not reproduce in actual results.
A. Extra production from reduced machine downtime
Planned operating hours for the 10 target machines are 10 machines x 8 hours x 2 shifts x 25 days x 12 months = 48,000 hours per year.
The current downtime rate is 18%, which is 8,640 hours per year. Visibility turns minor stoppage frequency and changeover variability into numbers, and by working down from the most frequent patterns, the target is set at bringing that downtime rate to 15%, an improvement of 3 points. The hours recovered are 48,000 x 3% = 1,440 hours per year.
This is where the central argument of this article begins. Freeing up 1,440 hours does not mean all of it turns into revenue. It converts into extra production only where there are orders to fill. The model assumes, based on the order outlook, that 60% converts, that is 864 hours.
At a contribution margin of THB 420 per machine hour, 864 x 420 = THB 362,880 per year.
B. Reduced record-keeping and data compilation work
This is a different domain from A. A is machine operating time; B is indirect labour hours.
Today, transcribing and compiling daily reports takes 2 people x 45 minutes per day x 25 days x 12 months = 450 hours per year. With data collected automatically, 80% of that work, or 360 hours per year, can be eliminated. At an hourly rate of THB 190, that is THB 68,400 per year.
One note when you present this benefit. It does not mean cutting headcount. It means the time that used to disappear into transcription goes into chasing the causes of defects and into improvement activity. Since you have to express the benefit as money, you convert at an hourly rate, but keep the internal explanation separate from that arithmetic.
C. Reduced emergency response and overtime for sudden failures
This too is a separate account from A. A counts hours the machine was stopped; C counts the extra spend incurred to recover. Overtime allowances for weekend call-outs, air-freighting parts, dispatching additional people, all of which arise on top of the downtime itself.
Today there are 8 incidents a year, at an additional cost of THB 22,000 per incident. If trend monitoring of current and vibration lets you pull signs of degradation into a scheduled maintenance window, the target is set at reducing this to 5 incidents a year. A reduction of 3 incidents gives 3 x 22,000 = THB 66,000 per year.
Building it up and calculating payback
- A, extra production, THB 362,880 per year
- B, record-keeping work, THB 68,400 per year
- C, emergency response, THB 66,000 per year
Total annual benefit is THB 497,280 per year, or approximately JPY 2.19 million.
Subtracting the running cost of THB 160,000 per year gives a net annual benefit of THB 337,280 per year.
Dividing the initial investment of THB 1,118,000 by that net benefit gives a payback of approximately 3.3 years.
Sensitivity analysis – which variable actually moves the payback
That 3.3 years moves considerably when the assumptions change. Look at two cases.
Case 1, a product mix with a high contribution margin. For a plant making products with a contribution margin of THB 600 per machine hour rather than THB 420, the extra production benefit becomes 864 x 600 = THB 518,400 per year. Total benefit is THB 652,800 per year, and net of running cost it is THB 492,800 per year, giving a payback of approximately 2.3 years.
Case 2, where the hours cannot be converted into production. If orders are thin and only 30% of the freed hours can go into extra production, the convertible hours drop to 432, and the extra production benefit falls to 432 x 420 = THB 181,440 per year. Total benefit is THB 315,840 per year, net is THB 155,840 per year, and the payback stretches to approximately 7.2 years.
Across those two cases, the unit price of a sensor has not changed by a single baht. The only thing that moved is whether the freed hours can be converted into revenue.
In our view this is the point most often overlooked when legacy equipment IoT is being evaluated. Once competing quotations are on the table, the discussion inevitably concentrates on comparing device unit prices and installation charges. Even if you negotiate 10% off the hardware, the initial investment moves by tens of thousands of baht and the payback barely changes. By contrast, whether the conversion rate is 60% or 30% splits the payback between roughly 3.3 years and roughly 7.2 years.
The practical conclusion follows from that. Before you choose the equipment, get sales and production planning to agree on what will be made in the freed hours. The reason for visualising the bottleneck process first ultimately comes down to the same thing, because however much downtime you strip out of a machine that is not the bottleneck, total plant output does not increase.
One more caution when you handle these numbers internally. Do not count the extra production benefit in A and the reduced emergency response in C together as one and the same “benefit from fewer failures.” A is an improvement in the downtime rate against planned operating hours; C is additional spend on recovery. They belong to different accounts. Whether you can keep those definitions separate throughout the explanation determines whether the numbers reconcile when results are reviewed after approval.
Where a PoC fits – what THB 425,000 for 3 machines buys is not payback but a basis for pricing
Where committing to 10 machines straight away is a difficult call, a PoC limited to 3 machines is an option. Here we look at a configuration of 3 machines using stack light taps only, as a completely separate scenario from Phase 1. Please read it without adding it to the Phase 1 figures.
Initial cost of the PoC, in THB
- Layer 1, site survey and requirements definition, 80,000
- Layer 2, sensors and edge devices, 99,000 (stack light taps 3 units x 18,000 plus edge gateway 1 unit x 45,000)
- Layer 3, electrical work and installation, 66,000 (3 machines x 22,000)
- Layer 4, software and visualisation platform, 120,000 (includes the tablet screen operators use to enter the reason for each stoppage)
- Layer 5, training and adoption support, 60,000
- Total THB 425,000
Running cost is THB 63,200 per year (cloud and connectivity at 3,600 per month x 12 = 43,200, plus maintenance 20,000).
The PoC benefit. The scope is narrowed to the 3 bottleneck machines, stop duration and stop count are turned into numbers, and the assumption is that the reason for each stoppage is filled in by operators on a tablet. Because that lets you concentrate on the most frequent stoppage patterns, the target is set at taking the downtime rate from 20% to 15%, an improvement of 5 points. A stack light tap on its own does not reveal why a machine stopped, so those 5 points are an assumption that depends on the tablet input being used alongside it. The 20% starting point is itself provisional, set on the view that the downtime rate of the 3 bottleneck machines is higher than the 18% assumed for the Phase 1 machines, and the actual figure is what the PoC is there to establish. Planned operating hours are 3 machines x 4,800 hours = 14,400 hours per year, the hours recovered are 720, and the 60% that converts into extra production is 432 hours. 432 x 420 = THB 181,440 per year. At the PoC stage, the reduction in record-keeping and compilation work (benefit B) is excluded and set to zero, because 3 machines alone will not change how daily reporting is actually run.
Net benefit is 181,440 minus 63,200 = THB 118,240 per year. Payback is 425,000 divided by 118,240, or approximately 3.6 years.
On payback alone, the PoC looks worse than Phase 1
To be straightforward about it, the PoC payback of approximately 3.6 years is longer than the approximately 3.3 years for 10 machines in Phase 1. The reason is plain. Layer 1 (survey), Layer 4 (platform) and Layer 5 (training) are largely fixed costs that do not scale with machine count. Spread across 3 machines, the per-machine burden is heavier.
So if you take a PoC to an approval meeting as an investment aimed at payback, it will look weaker on the numbers than Phase 1. The real value of a PoC lies elsewhere.
What you are buying is the basis for pricing and for estimating the benefit of the real rollout. Specifically, you get four things.
- Your actual downtime rate. Whether it is 18% or 25% cannot be known until it is measured. That number becomes the foundation of the Phase 1 benefit estimate.
- A measured conversion rate to extra production. You can capture, as three months of real results, what was actually made in the freed hours. The variable with the greatest leverage in the sensitivity analysis gets replaced with evidence rather than an estimate.
- Actual installation cost on site. The conditions you only discover once the panel is open become known in advance for 3 machines. You can validate whether the Layer 3 unit price is reasonable.
- Whether the floor actually uses it. Does looking at the dashboard change what gets discussed in the morning meeting? If that does not change, expanding to 10 machines will produce the same result.
Evaluate the PoC on whether you obtained those four things, not on payback. Rebuilding the Phase 1 estimate on that basis looks like a detour and is in fact the more dependable route.
Five local factors that actually trip projects up in Thai plants
Even with an identical technical configuration, projects in Thailand stall for reasons that differ from Japan. Five points worth building into the estimate and the plan.
1. Power quality and momentary voltage dips. Even inside industrial estates, lightning during the rainy season causes momentary voltage dips. The machine itself may recover while the edge gateway and network devices go into repeated restarts, and data for that interval can be lost. The design needs a small UPS on the gateway side, plus automatic recovery from a brief outage and a buffered resend mechanism. If you settle for an operating routine where someone manually restarts the devices after power is restored, you will get gaps on the days that person is off.
2. Panel space and missing as-built wiring diagrams. On equipment relocated from Japan, or bought second-hand locally, panels have often been added to repeatedly over the years and have no free space left. On top of that, the drawings are frequently not on site, and you have to trace by measurement which wire goes where. Opening the cabinet doors and taking photographs at the inventory stage improves the accuracy of the quotation and holds down later extra charges.
3. Congestion in the 2.4 GHz band and metal shielding. If you choose a wireless configuration, the RF environment inside the plant becomes the largest variable. Existing wireless LAN, operators’ smartphones and wireless barcode readers all share the 2.4 GHz band, while metal machines and frames block signals. Selecting devices without a site survey at the design stage tends to produce unstable communication after installation and a lot of time spent isolating the cause. We cover the design approach for in-plant networks in our article on factory wireless LAN and industrial networks. Consider it including the option of running cable wherever a wired segment is feasible.
4. Rainy-season humidity, dust and IP ratings. From May to October humidity is high, and there are locations where condensation forms. In processes where cutting-fluid mist or dust is in the air, the protection rating of sensors and cabling needs to go up. Putting office-grade devices straight onto the floor and having failures pile up six months later is an avoidable mistake. Record the environmental conditions for each installation location in the register and reflect them in device selection.
5. Maintenance staff turnover and handover. In Thai manufacturing, maintenance and process engineering staff can turn over within a few years. Build the system on the assumption that the key person who was briefed at implementation may not be there the following year. In concrete terms, that means leaving configuration-change procedures documented in Thai, writing dashboard definitions on the screen itself (what is the denominator of this chart), and keeping a history of threshold changes. The Layer 5 training cost is also the cost of that durability.
Implementation steps and a 12-week schedule, plus two months of hands-on support
Here is how the 12 weeks up to go-live run for the model case of 10 machines in Phase 1, and how the two months of hands-on support that follow are used. Installation and training finish inside the 12 weeks; the support period sits on top of that. Where you place the shutdown work is the crux of schedule management.

Weeks 1 to 2, inventory and site survey. Building the equipment register, measuring inside panels, confirming power and communication ports, and running an RF site survey. Interviewing staff on stack light rules also happens here. The quality of these two weeks determines the accuracy of every stage that follows.
Weeks 3 to 4, requirements definition and KPI setting. Decide what will be visualised, who looks at it and when, and what they decide as a result. Availability alone is not enough as a KPI. Unless you first decide the downtime categories (changeover, waiting for material, breakdown, quality adjustment, minor stoppage), compiling the data will not lead to action. Get production, maintenance and process engineering into the same meeting here.
Weeks 5 to 6, device selection and procurement. Lead times differ substantially between devices held in stock in Thailand and devices imported from Japan or China. Some parts take four to six weeks including customs clearance, so a late procurement start pushes the whole schedule. During this period, get the dates for the coming shutdown work onto the production plan.
Weeks 7 to 8, installation, first batch. Start with the 6 stack light taps. Because they do not touch the control circuit, the shutdown coordination is light and they can go ahead first. The first data starts flowing here, so you get an early check on whether the dashboard displays behave as intended.
Week 9, installation, second batch. The 2 current sensors and the 2 direct PLC connections. Since these require panel work and communication configuration, align them with a shutdown day already in the production plan, such as a scheduled maintenance day or the period around a long holiday. Trying to squeeze this into a normal working day is where coordination usually gets difficult, so the practical tip is to fix the date back in weeks 5 to 6.
Week 10, data validation. Cross-check whether the captured values match what the floor actually experiences. Errors in the stack light rules, CT orientation, and the time boundary used for aggregation (where you place the cut between the two shifts) are the kinds of discrepancy to flush out in this week. Skipping this and going straight into live operation tends to leave the floor with a lasting verdict that the numbers cannot be trusted.
Weeks 11 to 12, floor training and go-live. Start the routine of reviewing the dashboard at the morning meeting. Training is delivered in Thai and built around “what do you do when this number goes up,” rather than around how to operate the screen.
Two months of hands-on support after go-live, week 13 onward. This period sits outside the 12-week schedule and is the one included in Layer 5. In a weekly review, adjust how downtime categories are assigned, revisit thresholds, and add any further indicators people want to see. Whether the routine takes hold in the first month or two after go-live is what separates a benefit that shows up in the numbers from one that does not.
Five common failure patterns
1. Starting on all machines at once. Tackling all 30 machines simultaneously concentrates the installation shutdowns to the point where the production plan cannot absorb them, and even when data arrives, no one has capacity to analyse it. Going in stages, 10 machines in Phase 1 or 3 machines as a PoC, tends to deliver benefit sooner in the end.
2. Selecting devices before deciding the KPIs. The approach of “collect data first and think later” looks reasonable at a glance, but because the data to be collected has not been defined, there is no basis for device selection. Whether a stack light is sufficient or you need current waveforms is decided by working backwards from the KPI you want to see.
3. Handing the floor a screen and nothing else. Install a dashboard and stop there, and within a month no one is looking at it. Implementation only ends when who looks at what, when, and how they act on it, is embedded in the operating routine. That is the reason not to cut Layer 5.
4. Deferring integration with existing systems. Pushing integration with the production management system or ERP into “phase 2” means the floor ends up looking at the IoT screen while continuing to key data in separately. As long as double entry remains, the reduction in record-keeping work (benefit B) will not materialise. Draw the line on how far integration goes in Phase 1 at the requirements definition stage.
5. Leaving maintenance and calibration out of the estimate. Comparing on initial cost alone, choosing the cheapest proposal, and then finding there is no budget in year two is an avoidable situation. The running cost of THB 160,000 per year is a number to subtract from the benefit from the very start of the investment decision. The net annual benefit of THB 337,280 per year used in this article is the figure after that subtraction.
On a related point, industry media have reported survey results in which more than 50% of manufacturers regard the integration of OT (the equipment side) and IT (the information systems side) as a barrier to adoption. That integration is a technical problem and at the same time a question of internal roles. Check whether process engineering for the equipment, IT for the network, and production for the meaning of the data are all sitting at the same table at the requirements definition stage.
Frequently asked questions
What is legacy equipment IoT?
It is the practice of capturing operating data from equipment using retrofitted sensors and communication devices, without replacing the equipment itself, and taking that through to visualisation and analysis. It is also called retrofit IoT or brownfield IoT. It generally refers to the scope where you do not intervene in machine control and the focus is on bringing data out.
How much does retrofit IoT cost?
In the model used in this article, a Thai plant with 10 machines in Phase 1, the initial cost is THB 1,118,000, or approximately JPY 4.9 million. The breakdown is site survey 180,000, devices 318,000, electrical work 220,000, visualisation platform 260,000, and training and adoption 140,000 THB. Separately, running cost is THB 160,000 per year. A PoC configuration limited to 3 machines comes to THB 425,000 initially. Actual amounts vary with the age of the equipment, conditions inside the panels, and the scope of integration with existing systems.
Can you collect data from old equipment?
Even on equipment with no communication port, you can capture operating state from the stack light and load trends from a current sensor. Even on older models, if there is an RS-232C or RS-485 serial port, it may be possible to read from the PLC via Modbus. Industry media report that open protocols such as Modbus and OPC UA allow previous-generation PLCs to be connected to a modern monitoring platform. Since the range of available data differs machine by machine, an inventory and survey up front is the prerequisite.
How much can you learn from stack light data collection?
You get the three states of running, stopped and alarm, and from those, stop duration, stop count and how stoppages are distributed across the day. What you do not get is the reason for the stoppage, the process conditions, production counts, or alarm detail. Even so, simply turning stop duration and stop count into numbers is enough to prioritise which machines to investigate further. In practice, classification of reasons is filled in by combining this with input from the floor, such as selecting a stop reason on a tablet.
Can you capture equipment uptime logs if the PLC is old?
Even on a PLC without Ethernet, it may be possible if there is a serial port. It does, however, require documentation of the register address map, meaning which address holds which piece of data. Where that documentation is no longer on site, you have to go back to the equipment manufacturer or carry out verification work on the machine itself. That is the main reason the survey stage, Layer 1, takes cost and time. Where the documentation cannot be obtained, one legitimate option is to give up on reading from the PLC and switch to a combination of current sensors and the stack light.
Can retrofit sensors be installed without stopping the machine?
It depends on the method. A tap from the stack light takes little time and can often be handled during a changeover or a lunch break, but live wiring work is avoided for safety, so allow for a short shutdown window. Fitting a CT inside the control cabinet, or wiring to a PLC, is as a rule done with the power isolated. In the model case, the 6 stack light taps with light shutdown requirements are placed in weeks 7 to 8, and the 4 machines needing panel work are placed in week 9, aligned with a scheduled maintenance day. Splitting the work this way keeps the impact on production down.
Conclusion
Legacy equipment IoT is a way to go after utilisation without replacing the equipment. There are three places the data comes out, the stack light, current and vibration sensors, and a PLC connection, and cost and the amount of information available step up across them. Viewing cost in five layers, survey, devices, installation, platform and training, makes it readable which layer moves with your own conditions. In the model case, the initial cost was THB 1,118,000, running cost THB 160,000 per year, annual benefit THB 497,280 and net benefit THB 337,280, giving a payback of approximately 3.3 years.
That 3.3 years, however, moves with the assumptions. With a high contribution margin product mix it is approximately 2.3 years; if only 30% of the freed hours can go into extra production, it is approximately 7.2 years. What decides the payback is not device unit prices but whether freed hours can be converted into revenue. And the way to replace that assumption with measurement rather than estimation is a PoC at a scale of 3 machines. A PoC comes out behind Phase 1 on payback, but positioned as an investment that buys the basis for pricing the real rollout, it keeps the decision steady.
We support Japanese-owned plants across Thailand and ASEAN with everything from capturing data on existing equipment to building the visualisation platform and getting it adopted on the floor. Before getting into quotations, you are welcome to talk to us about nothing more than how to build the equipment register and which machines to start with. Starting by going through your own equipment list together and sorting out which extraction point looks workable is perfectly fine. You can reach us here.
References
- Xinhua, “Thailand’s industrial output slips 3.1 pct in June” https://english.news.cn/20260727/f8b7ceb202d04b1f8facbcbf44ed60ce/c.html
- Thailand Business News, “Thailand Secures $43.6bn 1H 2026 Investment Surge” https://www.thailand-business-news.com/pr-news/thailand-secures-43-6bn-1h-2026-investment-surge-as-big-tech-accelerates-southeast-asia-ai-infrastructure-push
- S&P Global, “Thailand Manufacturing PMI” https://www.pmi.spglobal.com/Public/Home/PressRelease/528f911b71054bad9861930a51dcb3cd
- iFactoryApp, “Greenfield vs Retrofit ROI Comparison 2026” https://ifactoryapp.com/greenfield-consulting/greenfield-vs-retrofit-roi-comparison-manufacturing-2026
- IndustryX.ai, “Retrofit Legacy Machines for IIoT” https://industryx.ai/2025/12/12/retrofit-legacy-machines-iiot-guide/
- InTechHouse, “Brownfield IoT – Retrofitting Legacy Industrial Machinery” https://intechhouse.com/blog/brownfield-iot-retrofitting-legacy-industrial-machinery-for-predictive-maintenance
- Procedia Computer Science, “Retrofitting of legacy machines in the context of Industrial IoT” https://www.sciencedirect.com/science/article/pii/S1877050922002149
- Yachiyo Solutions, “What is equipment retrofit” (in Japanese) https://yachiyo-sol.com/library/setsubi-retrofit/
- Conexio, “Retrofit with IoT” (in Japanese) https://conexio-iot.jp/blog/c121
- Omron, “What is OEE” (in Japanese) https://www.fa.omron.co.jp/product/special/maintenance-solution/column/column10/


