


“We added another warehouse building, but logistics cost as a percentage of sales has not moved at all.” “We went live with a WMS three years ago, and the spreadsheets on the floor are still there.” Almost every conversation we have about Southeast Asia logistics digital transformation starts with one of those two sentences. Whether the site is in Thailand or Vietnam, whether the company is a manufacturer or its in-house logistics subsidiary, the pain points are remarkably similar.
TOMAS TECH is based in Bangkok, and we implement IT systems for factories and warehouses in Thailand and neighbouring countries. What we feel every week on site is that 2026 is the year the region stops asking “should we invest at all?” and starts asking “in what order, and how far do we go?” The market data supports that shift. According to Mordor Intelligence, the Southeast Asian warehouse automation market is expected to grow from USD 910 million in 2026 to USD 1.63 billion in 2031, a compound annual growth rate (CAGR) of 12.36%.
At the same time, not every company that invests is getting results. Among organisations that increased AI investment, only 6% achieved a return within twelve months. This article puts the market numbers, the country-by-country differences, the state of logistics AI in ASEAN, the technology stack, and a realistic implementation sequence in one place, with sources cited throughout. Use it as raw material for the decision you actually have to make: what to do first.
The 2026 Southeast Asia Logistics Market: Structural Change in Numbers
Let us start with the numbers rather than with opinions. There is a practical reason for that. When you write an internal proposal and have to answer the question “why now?”, nothing works better than external data that your management cannot argue with.
Warehouse Automation in ASEAN Is Growing at a 12.36% CAGR
According to the Mordor Intelligence report “Southeast Asia Warehouse Automation Market”, the regional warehouse automation market will be worth USD 910 million in 2026 and is forecast to reach USD 1.63 billion by 2031. That is a CAGR of 12.36%.
It is worth being precise about what that 12.36% does and does not mean. It does not mean that if you automate, your costs fall by 12% per year. What it actually measures is the pace at which capital is being deployed around you. The company in the next lot of the same industrial estate, the third-party logistics provider in your supply chain, and your own customers are all changing their operating assumptions at that speed. If, five years from now, your warehouse is still running the way it ran in the early 2020s, there is a real chance you will no longer be able to meet what your customers consider a normal service level. Reading the CAGR as a statement about your competitive environment, rather than as a promise about your P&L, is the more useful interpretation.
There is a second, quieter implication. A market growing at double digits attracts vendors, integrators and engineering talent. That is good news for buyers, because it means more choice and more competitive pricing. It is also a warning, because a fast-growing market attracts newcomers whose local support capability has not caught up with their sales capability. We will come back to that point when we look at Vietnam.
Thailand’s Freight and Logistics Market Reaches USD 56.56 Billion in 2026
Now the Thailand-specific picture. According to the Thailand freight and logistics market report for 2026 to 2031 published by GII, the Thai freight and logistics market will grow from USD 53.38 billion in 2025 to USD 56.56 billion in 2026, expand at a CAGR of 5.95% between 2026 and 2031, and reach USD 75.47 billion by 2031.
The number that deserves attention is the relationship between the two growth rates. The overall logistics market is growing at 5.95%. The warehouse automation market is growing at 12.36%, more than twice as fast. In other words, investment in *changing how logistics is done* is growing faster than logistics volume itself. That is the signature of a market moving from quantitative expansion into a phase of qualitative change.
There is also a very concrete operational consequence hidden in the 5.95% figure. If the freight and logistics market grows roughly 6% per year, then in aggregate the number of shipments, transactions, documents and inventory movements keeps rising by roughly that amount. The question every operations manager should ask is simple: can we absorb a 6% annual increase in volume with the same headcount and the same way of working, every year, for five years? In most of the sites we visit, the honest answer is that today’s growth is being absorbed by overtime, by borrowing staff from other departments, and by the willingness of a handful of experienced supervisors to stay late. None of those three resources scales.
Supply Chain AI Is Growing on a Completely Different Curve from 3PL
Two more market figures are worth putting side by side, because the contrast between them is instructive.
The Southeast Asian third-party logistics (3PL) market, according to research by Report Ocean published via @Press, was worth USD 1,379.13 million in 2025 and is forecast to reach USD 2,350.55 million by 2035, a CAGR of 5.34% between 2026 and 2035. That is broadly in line with the growth of the overall freight and logistics market (5.95% in Thailand). Outsourcing is growing at roughly the same speed as the underlying demand for logistics, which is what you would expect from a mature service model.
The supply chain AI market looks nothing like that. In the 2026 supply chain AI statistics compiled by RELEX Solutions and Open Sky Group, the AI in supply chain market is projected to grow from USD 9.94 billion in 2025 to USD 236 billion by 2035. That is a different order of magnitude, and any forecast of that shape deserves scepticism. Ten-year projections with twenty-fold growth are built on assumptions that rarely survive contact with reality.
Still, even if you discount the absolute number heavily, one conclusion survives: capital and engineering talent are concentrating in this area. That matters for buyers, because it means the capability of the tools you can buy will keep improving faster than your ability to absorb them. But a large forecast market size and AI actually running in your warehouse tomorrow are two very different things. We look at that gap with real adoption data later in this article.
Country and Segment Differences Inside the Same Region
The same Mordor Intelligence report breaks the regional market down by country and by segment, and the differences are large enough to change decisions.
- Indonesia held a 28.63% revenue share of the Southeast Asian warehouse automation market as of 2025, making it the largest single market in the region. Cikarang Dry Port is cited as a key driver.
- Vietnam is forecast to post the fastest growth in the region through 2031, at a CAGR of 13%, driven in large part by the mega-hub build-out by Shopee and SPX Express.
- Thailand benefits from the depth of its automotive industry cluster and from the tax incentives available in the EEC (Eastern Economic Corridor).
By segment, retail and e-commerce held the largest share in 2025 at 33.40%, growing at a CAGR of 17.28%. Healthcare is growing at a CAGR of 13.81%, driven by Good Distribution Practice (GDP) compliance requirements and by growth in biopharmaceuticals.
If you run a manufacturing operation, there is one point in that breakdown that deserves more attention than it usually gets: the growth of warehouse automation in ASEAN is being led by e-commerce operators, not by manufacturers. Most of the solutions a vendor will bring to your meeting room were designed around the e-commerce fulfilment profile: piece picking, very high SKU counts, small order sizes, high order frequency, and unpredictable daily peaks. A manufacturing warehouse typically looks the opposite: pallet or case movements, a narrower SKU range, planned shipments tied to a production schedule, and demand that is lumpy but forecastable.
Apply an e-commerce-shaped solution to a manufacturing-shaped operation and the economics rarely work. So when you evaluate a proposal, the first question to ask is not about the technology. It is: “In which industry, and with what shipment profile, did this solution produce the results in your reference case?” If the answer is a marketplace fulfilment centre and you run a components warehouse feeding an assembly line, you are looking at a very different investment case from the one in the slide deck.
Why Logistics DX Now: Labour Shortage, Wage Inflation and E-Commerce
“The market is growing, so we should invest” is a weak motivation, and it rarely survives a budget review. What actually moves projects forward on the ground is a set of three much more immediate pressures.
Thailand’s Logistics Labour Shortage Has Passed the Point Where Money Solves It
A JETRO report on labour shortages in Thailand describes a situation in which logistics drivers are difficult to secure even at THB 25,000 per month including overtime pay. The same report notes that overtime is subject to a statutory limit, referring to a cap of 36 hours per month.
Those two conditions holding at the same time is more significant than either one alone. The traditional response to a labour shortage in logistics is to cover the gap with overtime from the people you already have. When there is a legal ceiling on overtime, that first-line response has a hard limit. That leaves three options:
- Raise wages further.
- Outsource the work.
- Increase throughput per person.
Logistics digital transformation is the approach to option three. It typically gets serious consideration only when options one and two have run into cost walls. A large number of Japanese-affiliated manufacturers operating in Thailand are standing at exactly that point right now, and it is why conversations that would have been theoretical three years ago are now attached to a budget line.
It is worth adding that the labour shortage is not evenly distributed. Drivers and experienced warehouse supervisors are the hardest roles to fill; general picking and packing roles are easier. That distribution matters for prioritisation, because the highest-value automation is usually the automation that protects the scarcest skill, not the automation that removes the largest number of hours.
Wages Have Risen Three Years in a Row
JETRO data also shows the wage increase rate at Japanese-affiliated companies in Thailand at 3.8% in 2023, 4.58% in 2024, and a projected 4.64% in 2025.
The individual numbers matter less than the shape of the trend: three consecutive years of increases, each larger than the last. A single year of wage inflation is a budget problem. Three years in a row is a structural condition that you have to design around.
The arithmetic is straightforward. At roughly 4.6% per year, labour costs rise by about 1.25 times over five years. As long as the same amount of work is being done by the same number of people, your logistics cost base grows automatically, without any change in volume, service level or footprint. Turn that around and you get a very usable internal argument: if you can build a mechanism that improves throughput per person by around 5% per year, you can absorb wage inflation without raising prices or cutting service.
We recommend framing logistics DX investment decisions in exactly those terms — as a race against wage inflation rather than as a technology initiative. Finance directors who are unmoved by a discussion of warehouse robotics tend to engage immediately when the same proposal is presented as a hedge against a known, compounding cost increase.
The Working-Age Population Starts Shrinking in 2026
Behind the wage numbers sits a more structural factor: demographics. According to the JETRO report, Thailand’s working-age population (15 to 65) stood at 46.85 million as of 2022 but is expected to begin declining from 2026.
That makes 2026 a genuine turning point for the Thai labour market. Recruitment strategies in Thai manufacturing and logistics have long assumed a steady flow of workers from the provinces into the industrial corridors. When the underlying pool starts to contract, that assumption stops holding. This is different in kind from a cyclical hiring squeeze in which a strong economy makes recruitment temporarily hard. A cyclical shortage reverses. A demographic one does not.
For Japanese-affiliated companies there is a silver lining here, because this is a transition Japanese manufacturing went through starting in the late 1990s. The labour-saving know-how accumulated in Japanese plants over the past twenty-five years — standardised work, visual management, automating the transfer of information rather than only the movement of goods — transfers reasonably well to Thai and Vietnamese sites. The organisations that do best are usually the ones that treat that know-how as a reusable asset rather than reinventing it locally.
E-Commerce at a 17.28% CAGR Is Resetting the Service Standard for Every Warehouse
The third pressure is the growth of e-commerce. As noted above, retail and e-commerce is the largest segment of the Southeast Asian warehouse automation market at 33.40% share in 2025, growing at a CAGR of 17.28%.
It is tempting for a B2B manufacturer to conclude that this is somebody else’s problem. We think that is a mistake, for two reasons.
First, the expansion of e-commerce logistics raises the baseline service level for the entire logistics industry. Next-day delivery, real-time shipment tracking, and API access to order and dispatch status become normal in the consumer world, and B2B customers then expect the same. This is not a hypothetical. Over the last two to three years, we have seen a clear increase in enquiries that begin with “our customer has asked us to send advance shipping data through a system interface, and we currently produce that information by hand.” The request comes from the customer, not from the IT department, and it is very difficult to refuse.
Second, e-commerce operators are direct competitors for logistics labour. When a player such as SPX Express builds mega-hubs across ASEAN, it recruits from the same labour pool as your warehouse, often with more flexible shift patterns and more aggressive hiring. The labour shortage pressure and the e-commerce pressure are two sides of the same coin, and they compound rather than offset each other.
Where Logistics AI in ASEAN Actually Stands: What the Adoption Gap Tells Us
Everything above is about why you should act. This section is about how far the market has actually got, based on adoption data. We treat this as the most important part of the discussion, because in our experience the single biggest determinant of whether a logistics DX project succeeds is whether expectations were set correctly at the start.
77% of Vendors Offer AI, but Only 35% and 10% Run It in Production
In the 2026 survey by Inbound Logistics of logistics and supply chain IT providers, 77% of vendors reported offering AI capabilities. That is up 6 points year on year and up 27 points compared with 2024. Machine learning capability was offered by 48% of vendors, up 7 points. On the supply side, AI has effectively become standard equipment.
The demand side looks very different. According to Sage’s “2026 State of Supply Chain Report”, 35% of logistics companies have AI running in live operations. In retail and wholesale supply chain operations, the share with AI genuinely in production is only 10%.
Set those numbers next to each other. Supply: 77%. Production use: 35%, or 10% depending on the sector. That gap is the distance between “buying a product that has AI features” and “having AI produce results in your business.” It is easy to make a vendor write “AI capability included” in an RFP response. Whether that capability ever runs on your data, on your processes, with your people, is an entirely separate question.
The question we always ask in a proposal meeting is this: does the data that this feature needs in order to work actually exist in your operation today? Demand forecasting AI needs several years of clean shipment history. Anomaly detection needs sensor data captured during normal operation, and enough of it to establish what normal looks like. Route optimisation needs accurate master data on locations, vehicle capacity and time windows. Without the data, no algorithm performs, regardless of how good it is. We covered the state of autonomous and agentic AI in a separate article, AI Agents in Manufacturing 2026: A Practical Guide for Thai Plants, and the picture in manufacturing is the same as in logistics: in the overwhelming majority of cases, the bottleneck is the state of the data, not the performance of the model.
The Top Customer Challenge Is Cost Reduction at 85%, a Problem That Sits Below AI
The same Inbound Logistics 2026 survey reports what IT vendors perceive as their customers’ biggest challenges:
- Cost reduction: 85% (up 5 points year on year)
- Visibility: 80% (up 5 points)
- Use of AI: 63% (a newly added item, up 16 points)
- Data management: 56% (up 9 points)
The ranking is revealing. The top challenge is not AI. It is cost reduction, followed by visibility. AI use ranks third at 63%, and data management sits at 56%, up 9 points year on year.
Read as a whole, this tells you that what customers are genuinely struggling with is still “our costs will not come down” and “we cannot see what is happening.” AI is rising as a perceived *means* to those ends, not as an end in itself. And our reading of the 9-point rise in data management is that it reflects companies that tried AI and hit the wall of incomplete, inconsistent or missing data. Data management moves up the agenda after the first AI pilot, not before it.
This has a direct implication for how you write your requirements. If your project charter says “implement AI in logistics”, you have chosen a technology before defining a problem, and you have no objective way to judge success. If it says “reduce cost per shipment by X%” or “cut the time between goods receipt and stock availability from Y hours to Z hours”, then AI, automation, process change or simply better master data all become candidate answers, and you can compare them honestly.
Warehouse Visibility at 44%, Down 22 Points from 2023: A Paradox Worth Unpacking
The hardest number in the survey to interpret is this one. TMS (transportation management system) offerings were reported by 44% of vendors, down 7 points year on year. Warehouse visibility (RFID/IoT) was also at 44%, down 22 points compared with 2023.
So AI offerings rose 27 points while warehouse visibility offerings fell 22 points. The tempting conclusion is that visibility is a solved or obsolete technology. We do not think that is right. There are three more plausible explanations:
- Feature absorption. RFID and IoT-based visibility has stopped being a standalone product and has been absorbed into WMS and platform products as a standard capability, so vendors no longer list it separately as a distinct offering.
- A shift in vendor messaging. With limited space in a proposal or a survey response, vendors have pushed AI to the front and moved visibility into the background. In that case the numbers reflect a change in marketing emphasis rather than a change in what is installed in warehouses.
- An investment plateau. The large and early-adopting companies have finished their first wave of visibility investment, and the flow of new projects in that category has slowed.
Whichever explanation you prefer, the practical conclusion is the same. Visibility still sits at number two in the customer challenge ranking at 80%, so the need has not disappeared. It has simply been pushed out of the headline by AI in vendor messaging, while as an operational pain point it has, if anything, intensified.
The action item follows directly: when every proposal on your desk is about AI, that is exactly the moment to ask yourself whether the visibility layer underneath is actually complete. If your team still cannot answer “where is this pallet right now and when did it last move?” without a phone call, no amount of AI on top of that will produce reliable output.
ROI in One Year: 6%. The Realistic Range Is Two to Four Years
For expectation-setting, this is the most important number in the article. According to the 2026 supply chain AI statistics compiled by RELEX Solutions and Open Sky Group, 85% of organisations increased their AI investment over the past twelve months, but only 6% achieved a return on that investment within one year. Most organisations reached a satisfactory return over a period of two to four years.
Our strong view is that this is precisely the number you should disclose honestly when you seek internal approval, rather than the number you should hide. It is counter-intuitive, so it is worth explaining why.
If you build a business case on a twelve-month payback, then at around month nine somebody will run a review, find that the benefits have not yet materialised, and conclude that the project is failing. In practice, month nine is often the point at which the system is nearly ready to go live and the accumulated effort is about to start paying off. We have seen projects stopped at that exact point more than once, and it is one of the most expensive mistakes an organisation can make, because the sunk cost is total and the organisational memory of “we tried that and it did not work” lasts for years.
If instead you agree at the outset that payback will take two to four years, but that by month twelve a specific set of intermediate indicators should have improved, you build the tolerance to survive the mid-project dip. Good intermediate indicators are operational KPIs that move earlier than financial ones:
- Inventory accuracy, or the discrepancy rate between system and physical stock
- Time per picking transaction
- Number of days required to complete a physical stock count
- Variability (not just the average) of shipping lead time
- Number of manual data entry or re-entry steps remaining in the flow
- Volume of exception handling: how often staff have to work around the system
Agree these before kick-off, measure the baseline before anything changes, and report them monthly. This is the single cheapest piece of project insurance available.
The 15% with “No Plans for AI” Are Not Ideological Objectors
The same statistics report that 15% of organisations have no plans to introduce AI into their supply chain. Importantly, the reason given is not philosophical opposition to AI. It is resource constraints.
That matches what we see at Japanese-affiliated sites in Thailand and Vietnam almost exactly. We rarely meet an IT manager who says “we do not need AI.” What they say is: “I am fully occupied with maintaining the core system and running the help desk, and there is nobody available to run a new project.” At many local subsidiaries the IT function consists of one to three people, and those people are also handling requests from the parent company in Japan, local user support, hardware refreshes, network issues and audit responses.
The conclusion is that when you build an execution plan for logistics DX, you have to decide who will run it with exactly the same rigour you apply to technology selection. Not the vendor’s project manager. Your person, with a name, with a defined percentage of their time, and with the rest of their workload explicitly reduced or reassigned. If that question is left vague at contract signature, the project tends to stop quietly about three months after kick-off, without anybody formally cancelling it.
Where an internal owner genuinely cannot be freed up, the honest options are to reduce the scope until it fits the available capacity, or to buy the project management capacity externally with a clear handover plan. What does not work is assuming that an already saturated team will find the time.
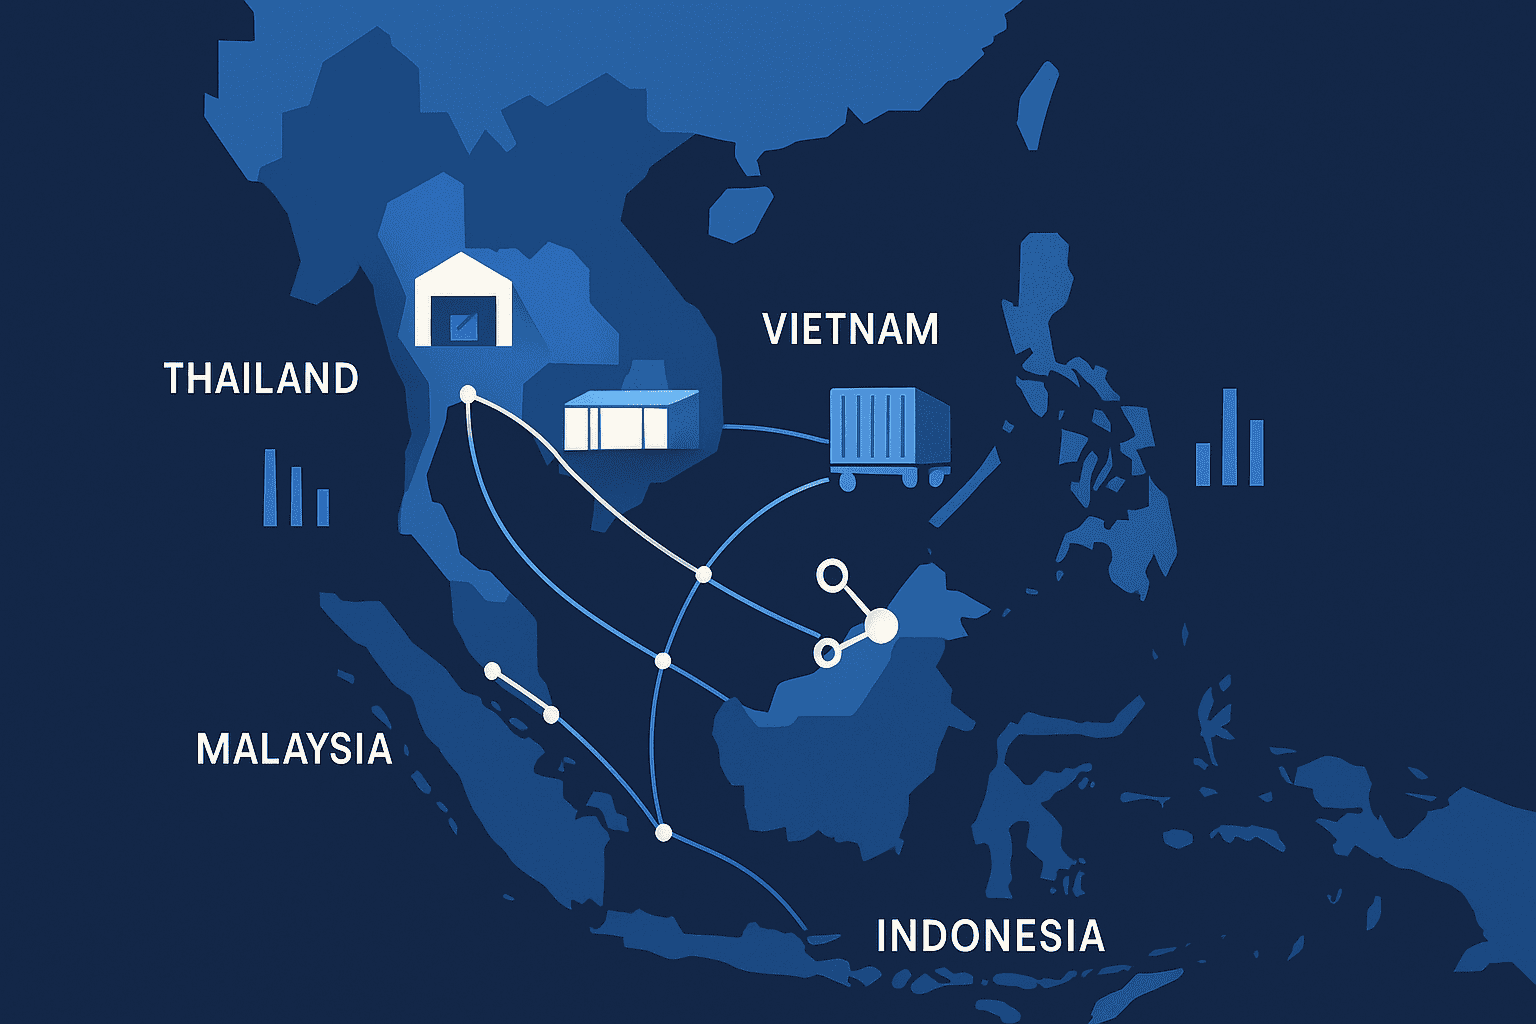
Country by Country: Thailand, Vietnam, Indonesia, Malaysia and Singapore
Treating “Southeast Asia” as a single market leads to bad decisions. This is especially true for regional headquarters teams responsible for several countries, where a policy that makes sense in one location can be counterproductive in another.
Thailand: EEC, the Automotive Cluster, the Land Bridge and BOI Incentives
Thailand’s structural strengths are the depth of its automotive industry cluster and the tax incentives available in the Eastern Economic Corridor (EEC). Mordor Intelligence cites both as tailwinds for the Thai market.
The automotive point deserves elaboration, because it explains why warehouse automation in Thailand has a different character from warehouse automation in a purely consumer-driven market. Automotive supply chains are multi-tiered, carry very high part counts, and come with demanding traceability requirements. Tier 1 and Tier 2 suppliers have to know which lot went into which assembly and when. That industrial structure keeps demand high for data integration between the warehouse and the production line — not just automation of physical movement, but automation of the information that has to move with it.
On the policy side, the renewed BOI (Board of Investment) incentives for 2026 to 2027 are important. According to analysis by Alvarez & Marsal, these incentives cover a broad range of industries including logistics, and offer benefits such as 100% foreign ownership, corporate income tax exemption, import duty exemption, and land ownership rights. For a company evaluating warehouse automation equipment or systems investment, the ability to align the timing of a capital plan with this incentive window can translate into a material cost difference. At minimum, it is worth confirming BOI eligibility before you finalise an investment decision rather than after.
On infrastructure, the Land Bridge project connecting Chumphon and Ranong is moving forward. According to a Lexology analysis, the project uses a PPP Net Cost model with a 50-year concession, the Office of Transport and Traffic Policy and Planning (OTP) is preparing bidding documents, construction is targeted to begin in 2026, and the first phase is expected to open in 2030. The scope covers ports, logistics infrastructure, rail, industrial estates and warehouses, as well as customs and trade facilitation technology and digital infrastructure.
Two caveats are in order. The Land Bridge has not broken ground, and there is no guarantee that a project of this scale proceeds on schedule. Long-horizon infrastructure programmes in any country slip. But one detail is worth noting regardless of timing: customs and trade facilitation technology and digital infrastructure are part of the concept from the outset. If national logistics infrastructure increasingly assumes digital interfaces, then a company whose documents and data still live in paper and spreadsheets will not be able to connect to it. That is a reason to fold a “can we exchange data with external parties in a machine-readable form?” requirement into your medium-term IT roadmap toward 2030, independently of whether the Land Bridge opens on time.
On workforce development, market reporting indicates that Thailand has made a USD 200 million investment in logistics workforce training and is positioning Bangkok as an integrated hub. That context is useful internally: it shows that the country is funding operator skills, not only physical infrastructure, and it supports the argument that training budget in your own project is not optional overhead.
One more data point illustrates Thailand’s position. Market reporting notes that Daifuku has expanded its intralogistics business in Thailand, manufacturing automated storage and retrieval systems (AS/RS) locally and exporting them to Singapore, Malaysia and Vietnam. Thailand is becoming not only a destination for automation equipment but a supply base for it. For a buyer, that has practical consequences: local manufacturing generally means better local engineering support, shorter lead times on spare parts, and less exposure to import logistics when something breaks. Those factors rarely appear in a vendor comparison sheet, and they should.
Vietnam: 13% CAGR, VILOG 2026 and the National Digital Transformation Program
Vietnam is forecast to be the region’s fastest-growing warehouse automation market through 2031, at a CAGR of 13%, with mega-hub construction by Shopee and SPX Express as a major driver.
Policy is aligned with that growth. Under the National Digital Transformation Program 2030, the government is promoting the adoption of WMS, TMS, AI, IoT and blockchain. According to reporting by VOV, VILOG 2026 in Ho Chi Minh City is built around the themes of smart logistics and green logistics, and Vietnam SuperPort has published a digitalisation roadmap that includes AI-based warehouse management, real-time inventory tracking and demand forecasting.
The caution we would offer about Vietnam is that a high growth rate does not automatically translate into ease of implementation. A 13% CAGR means the market is expanding rapidly, which in turn means that the supply of skilled people, experienced vendors and supporting infrastructure may not be keeping pace with demand. In practice this shows up as longer vendor lead times, higher engineer turnover, and support models that look strong on paper and thin in reality.
When you select a vendor in Vietnam, do not stop at confirming that they have a sales office in the country. Ask how many engineers capable of supporting your specific product are physically located in Vietnam, what the escalation path is when the first-line engineer cannot resolve an issue, what the response time commitment is in writing, and which language the support is delivered in. Ask to speak to a reference customer who has been live for more than a year, because the support model only reveals itself after go-live.
On the positive side, an environment where national policy explicitly supports digitalisation is a significant help in building internal consensus. “This is consistent with the direction of the national programme” is an argument that works with a Japanese head office and with local authorities alike, and it is often easier to get approval for a Vietnam project than for an equivalent project elsewhere in the region for exactly that reason.
Indonesia: The Largest Market at 28.63% Share
Indonesia held 28.63% of the Southeast Asian warehouse automation market as of 2025, making it the largest market in the region, with Cikarang Dry Port cited as a driver. Given the size of the population and the depth of the e-commerce market, that position is unsurprising.
The qualification to keep in mind is geography. Indonesia is an archipelago, and logistics conditions in and around Jakarta differ enormously from conditions elsewhere in the country. Road quality, inter-island shipping schedules, availability of skilled technicians, and even reliable power supply vary by region. A national market size figure tells you about the country as an investment destination; it tells you very little about the operating conditions at your particular site. Do not let a headline number about “the largest market in Southeast Asia” substitute for a site-level assessment of the conditions your own facility actually faces.
Malaysia and Singapore: Large-Scale Smart Warehouse Investment
Several 2025 investment announcements illustrate where the regional standard is heading.
In Malaysia, in August 2025, S P Setia announced a partnership with ALP Taiwan to develop a smart warehouse campus in Klang with a total value of around USD 900 million. In December 2025, Chin Hin Group and PTT Synergy established a joint venture to develop smart warehouses in the Klang Valley and Penang.
In Singapore, in July 2025, NCS Group launched a SGD 130 million predictive analytics programme for warehouse robotics.
What these projects have in common is that none of them is simply a warehouse building. They are described from the outset as smart warehouses and predictive analytics programmes — that is, facilities designed around data and software rather than facilities to which software might later be added. The consequence for existing operators is uncomfortable but straightforward: as the standard specification for new warehouse capacity in the region rises, the operations running in older facilities look progressively less competitive to the customers comparing them. You do not have to match a USD 900 million campus. You do have to be aware that the reference point your customers use is moving.
What the Country Comparison Means in Practice
The question we hear most often from companies with sites in several countries is “which country should we start with?” Our answer usually surprises people: not the country with the highest growth rate, but the site where the data is in the best condition.
The logic is simple. If your first project does not succeed, you will not get budget for the second site. A failure in a high-growth country with an immature vendor ecosystem can set the entire regional programme back by several years, because the story that circulates internally is “we tried logistics DX and it did not work”, not “we chose a difficult first site.”
So build the template at the site with the most favourable conditions: cleanest master data, a capable and cooperative site manager, a reasonably stable shipment profile, and a vendor with genuine local support. Prove the model there, document what worked, then roll it out. Counter-intuitively, starting where it is easiest is usually the fastest route to regional coverage, because each subsequent deployment is cheaper, faster and lower-risk than the first.
One caveat: “best data condition” does not mean “smallest site.” A site so small that nobody notices the improvement produces a template that nobody wants to copy. You want the easiest site among those large enough for the results to matter.
How to Combine WMS, TMS, IoT and AI
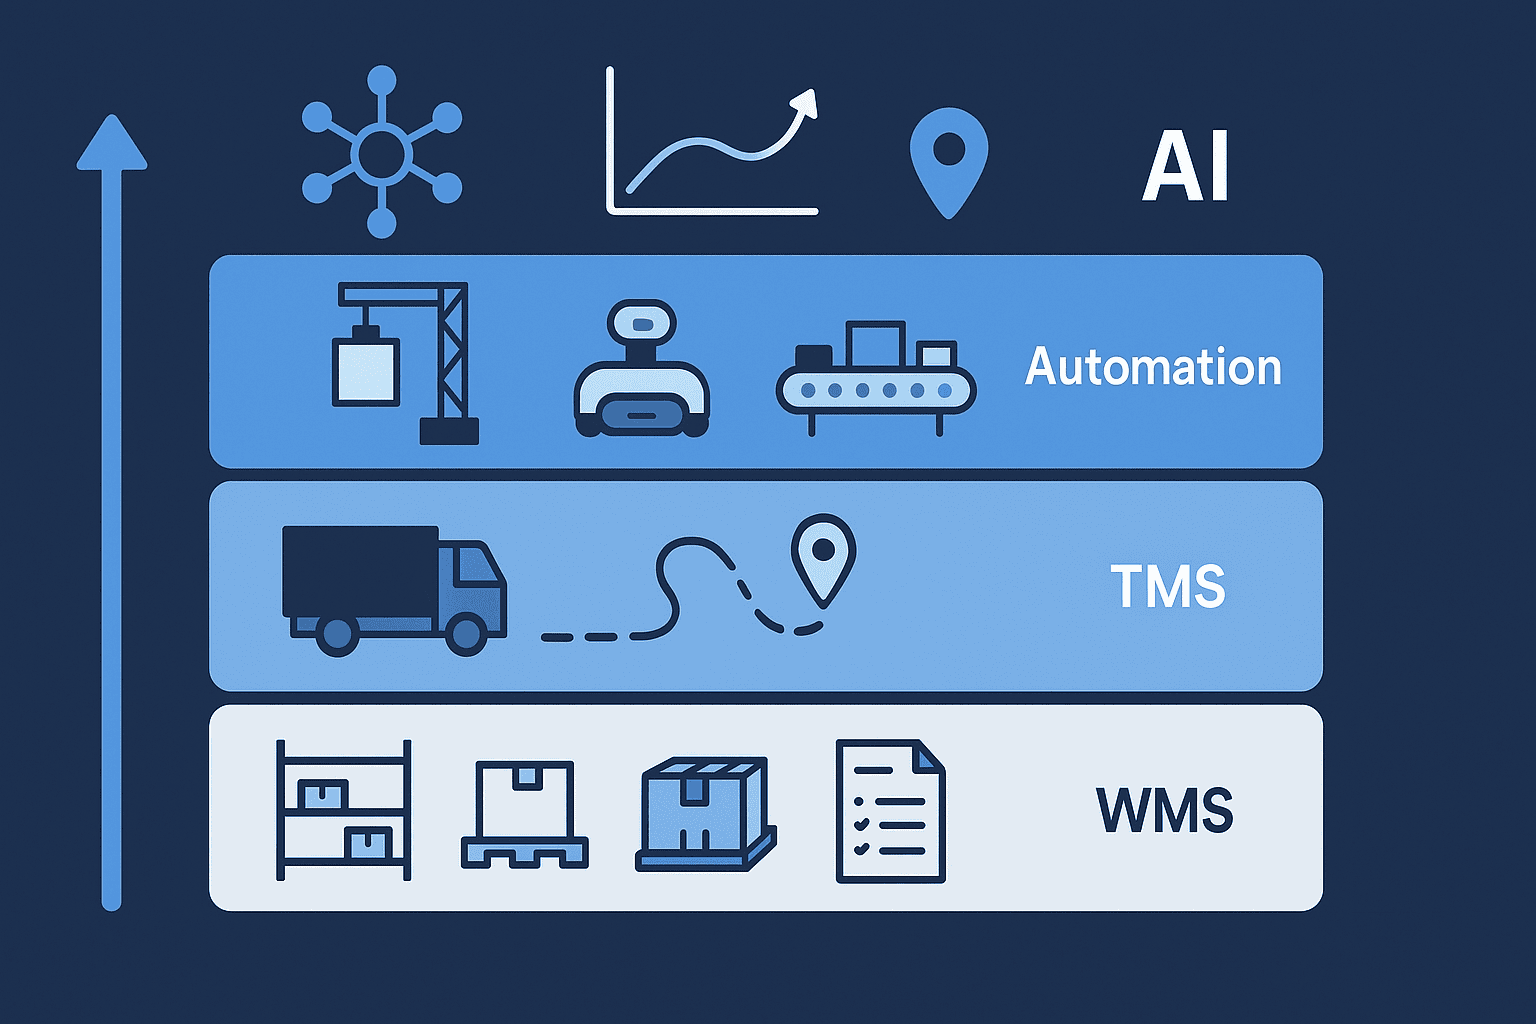
Now to the technology. “Logistics DX” covers a wide range of technologies, and treating them as a single undifferentiated thing is the reason so many internal discussions go in circles. We separate the discussion into four layers.
Layer 1: WMS, the Foundation Everything Else Stands On
A warehouse management system records the location, quantity and status of inventory and manages the transactions for receiving, putaway, picking, shipping and stock counting. In a conversation about AI and robots it looks unglamorous. It is also the layer that determines whether anything above it can work at all: if this layer is not solid, nothing built on top of it will function.
The reason is that every higher layer consumes data that the WMS produces. Demand forecasting AI consumes shipment history. Automated material handling consumes accurate location data. Visibility dashboards consume inventory transactions. If there is no WMS, or if there is a WMS that the floor does not use correctly, everything stacked above it is built on sand.
What we see most often in Thailand is not the absence of a WMS. It is a site that has “already implemented WMS” where the reality does not match the label. The typical pattern looks like this:
- Goods receipt is registered in the WMS, but movements between internal processes are tracked in spreadsheets
- Location management exists in the system, but in practice operators put stock “somewhere around here” and rely on memory
- Stock count discrepancies are adjusted in the system to make the numbers agree, which means the root cause of the discrepancy is never traced
- Actual operational data is exported to a spreadsheet daily, and all analysis from that point onward happens in the spreadsheet
- Reports that management relies on are produced by one person who manually reconciles several files, and nobody else knows how
Statistically, every one of those sites counts as “WMS implemented.” As a data asset, none of them is usable. So when you plan a logistics DX initiative, the honest starting point is an inventory of what is genuinely running in the system versus what is running beside it. This is uncomfortable to do, because it involves telling head office that a system they approved five years ago is not being used as designed. Doing it anyway is what separates projects that work from projects that repeat the same failure with newer technology.
A related point on WMS in Thailand specifically: bilingual operation is not a cosmetic issue. If the operator-facing screens and the exception messages are only in English, error rates rise and workarounds proliferate. We have seen more than one WMS abandoned in practice for no deeper reason than that the people expected to use it could not read the messages it produced under pressure.
Layer 2: TMS and Visibility
Where WMS covers what happens inside the four walls, a transportation management system covers what happens outside them: planning, executing and recording transport and delivery. In the Inbound Logistics 2026 survey, TMS was offered by 44% of vendors, down 7 points year on year. Given that visibility ranks second among customer challenges at 80%, the natural reading is that demand for visibility in the transport domain remains high even as vendor emphasis shifts.
The same layer includes warehouse visibility through RFID and IoT: sensors, handheld terminals, gate readers, and collection of operating data from equipment. This is the physical layer that converts the movement of real objects into digital data.
The awkward thing about investing in this layer is that on its own it produces very little direct cost reduction. Making something visible does not, by itself, reduce anything. The benefit appears only when you change the way you operate as a result of what you can now see. That is why, whenever we propose a visibility investment, we insist on defining not “what will become visible” but “what we will change once we can see it.”
Concretely, that means writing down, before the sensors are installed, statements of the form: “If we find that more than X% of picking time is spent walking to low-frequency locations, we will re-slot the fast movers within one month.” A visibility project with no pre-agreed decisions attached to it delivers a beautiful dashboard that nobody opens after the third month. A visibility project with three or four pre-agreed decision rules pays for itself, because somebody is obliged to act on what appears.
Layer 3: Physical Automation (AS/RS, AMR and Automated Sorting)
This is the layer of physical automation. As noted above, Daifuku has expanded its intralogistics business in Thailand and manufactures AS/RS locally, which improves the practical support picture for buyers in the region.
When evaluating an automation equipment investment, we recommend checking three things in this order:
- Stability of the shipment profile. Are the product mix and shipping patterns stable over a horizon of several years? Fixed automation assumes stability. In an operation where the mix changes frequently — new product introductions, seasonal swings in SKU composition, customers being onboarded and offboarded — a fixed installation is difficult to pay back, and flexible solutions such as autonomous mobile robots or improved manual processes often win.
- Absolute volume level. The benefit of automation scales with volume. Below a certain number of transactions per day, the depreciation and maintenance burden exceeds the labour cost you remove. Calculate this honestly with your actual daily volume, not with the volume in your growth plan.
- Accuracy of upstream data. Automated equipment operates on the assumption that location and inventory data are correct. Introduce automation on top of inaccurate data and you increase the amount of human exception handling, which is the opposite of the intended outcome.
The third point is the one most often overlooked, and it is worth stating as a principle: automation is a technology that demands data accuracy; it is not a technology that creates data accuracy. A manual process can tolerate an operator noticing that the label is wrong and quietly fixing it. An automated process cannot. Every informal correction that experienced staff make today without mentioning it becomes a system exception tomorrow. Before automating, it is worth spending a week simply counting how many such corrections happen.
Layer 4: Supply Chain AI, and What Logistics AI in ASEAN Can Realistically Do Today
The top layer is AI: demand forecasting, inventory optimisation, transport route optimisation, anomaly detection, and automated document processing, among others.
The constraint that governs this layer is that AI only works within the boundaries of what the three layers below it have established. The gap described earlier — 77% of vendors offering AI, while only 35% of logistics companies and 10% of retail and wholesale supply chain operations run it in production — is, in our reading, largely an expression of that constraint. It is not that the AI does not work. It is that the data foundation required to run it does not exist in most operations.
There is, however, one important exception. Document-oriented AI — technologies such as AI-OCR that convert unstructured data from invoices, customs documents and purchase orders into structured data — can often deliver value on its own, regardless of how complete the underlying systems are. It sits beside the existing stack rather than on top of it. That is one of the few genuine exceptions to the rule that AI should come after the lower layers are in place, and we return to it below.
Sequencing: Build From the Bottom, With One Exception
Putting it together, the sequence we recommend is:
- Raise the operational quality of your WMS. Either implement one, or correct how the existing one is used. The test is not whether the system is installed but whether the physical reality and the system record agree without manual reconciliation.
- Complete the visibility layer. IoT and RFID, automated collection of actual performance data, and elimination of manual data re-entry between steps.
- Add AI. Forecasting, optimisation and anomaly detection, applied to the data the first two layers now produce reliably.
- Consider physical automation. Start in the areas where volume and stability conditions are both satisfied, rather than automating the area that is most visibly painful.
Some readers will notice that we place physical automation after AI, which is the reverse of the usual order in vendor roadmaps. The reasoning is the third checkpoint above: automation is the least tolerant of poor data, and it is the most expensive to reverse. Software decisions can be unwound in months. A conveyor and racking installation cannot.
The exception to the sequence is document-processing AI such as AI-OCR, which can be started early and independently. It delivers results in a short time frame and the reduction in workload is immediately obvious to the people doing the work, which makes it a practical way to take the first step in logistics DX.
What We at TOMAS TECH See on the Ground
Allow us a short section about our own work. Everything above is market data and general principle; what happens on an actual site is messier.
TOMAS TECH is based in Bangkok and implements systems for Japanese-affiliated manufacturing and logistics operations in Thailand and neighbouring countries. Our work centres on our own PEGASUS production management system, together with IoT-based equipment data collection, AI-OCR automation of customs and order documents, energy management, and FA and robot control solutions. Most of our projects start not with a technology decision but with somebody explaining that the numbers in two systems do not match and nobody knows why.
“Automation Does Not Work Where the Data Is Not Structured”
If we had to compress everything we have learned across many projects into one sentence, this would be it.
When an automation or AI implementation fails to deliver, the cause is rarely the algorithm and rarely the equipment. It is almost always the data going in. The patterns repeat across companies and across countries:
- Part numbering conventions differ between the factory and the warehouse, so the same item exists under two identities
- The same component is registered under several different names because it was added by different people at different times
- Date formats vary by the person entering them, so chronological sorting silently produces wrong results
- Units of measure are mixed — pieces in one record, boxes in another, with no reliable conversion factor
- Customer names exist in three variants, so shipment history cannot be aggregated by customer without manual cleaning
- Free-text notes fields carry business-critical information that no system can read
Stack a higher-level system on top of that and the result is a mountain of exceptions that people have to work through by hand. Total workload goes up, not down, and the organisation concludes that the technology was oversold.
For that reason, when a client asks us about AI, we start by asking to see the current state of their data. Three measures tell us most of what we need to know:
- Master data duplication rate. How many entries in the item master refer to the same physical thing?
- Transaction completeness. What percentage of expected transaction records are missing, blank, or filled with placeholder values?
- Manual entry ratio. What proportion of fields are typed by a human rather than captured automatically or inherited from an upstream record?
Those three numbers give a good estimate of how many months a project will take, long before any discussion of software. They are also the numbers most likely to be missing from a vendor’s estimate, which is why estimates so often expand after contract signature.
We examined how far autonomous AI agents can now go on the factory floor in AI Agents in Manufacturing 2026: A Practical Guide for Thai Plants, and the conclusion there is the same as here. For an agent to make decisions autonomously, the information on which the decision depends has to exist in machine-readable form. Far from making data preparation less important, the arrival of more capable AI has made it more important, because the range of decisions you can delegate is bounded by the range of things the system can actually read.
Why AI-OCR Is Often the Right First Step
In logistics, the first thing we most often propose is AI-OCR for customs documents and order or purchase documents. There are three reasons.
- No modification of existing systems is required. Converting paper or PDF into structured data is a process that can be completed alongside your core systems. You can start without touching the existing WMS or ERP, which keeps risk low and avoids a long change-control cycle with head office.
- The results are easy to quantify. “How many documents per day, and how many minutes each?” is easy to measure, and the before-and-after comparison is unambiguous. That makes the follow-up report to whoever approved the budget straightforward, which matters more than people expect for getting the second project funded.
- There is little resistance from the floor. The work being replaced is transcription that nobody enjoys and nobody regards as their professional contribution. That is very different from proposing to change how a skilled planner does their job.
The first move in logistics DX should be to create a success story. If the people on the floor experience the first project as “that made my day easier”, you will get their cooperation on the second and third initiatives, including the ones that require them to change how they work. If, instead, you open with a large-scale system replacement that exhausts everyone, you will find that no proposal gets traction for the next two to three years, regardless of its merits. The technical quality of the first project matters less than the emotional memory it leaves behind.
IoT and Energy Management: A Different Door Into the Same Building
The other area we frequently handle is IoT data collection from equipment and energy management. At first glance that sits outside logistics DX. In practice the two are closely connected.
Warehouse energy costs — air conditioning, lighting, refrigeration and freezing equipment — represent a non-trivial share of total logistics cost at some sites, particularly temperature-controlled ones. Electricity data is also a mirror of how equipment is actually operating. Abnormal consumption patterns can reveal deteriorating equipment, doors being left open, refrigeration running in empty zones, or shifts that start their equipment forty minutes before anyone arrives. Each of those is a finding that improves the return on the visibility layer without requiring any new process.
There is a second reason we like this entry point. Once an IoT data collection platform exists, it is comparatively easy to extend its use. A platform installed for energy management can be extended to equipment utilisation monitoring and to temperature and humidity monitoring, which is particularly important in healthcare logistics where GDP compliance is required. As noted earlier, the healthcare segment of the Southeast Asian warehouse automation market is forecast to grow at a CAGR of 13.81%, driven partly by GDP compliance and biopharmaceutical growth, and record-keeping requirements in this area are tightening rather than relaxing. Building a collection platform that can carry compliance data later, even if today it only carries kilowatt-hours, is a cheap option to hold.
A Realistic 6 to 18 Month Implementation Roadmap
Finally, the execution plan. Given the reality that payback typically takes two to four years, the question becomes how to design the first eighteen months so that the programme survives long enough to reach that payback.
Step 1 (Months 0 to 1): Inventory the Process and the Data
Start by writing down the current state honestly. The critical point is that you are documenting the actual business process, not the system architecture diagram. The purpose of this step is to find the gaps between the two: the process that is supposed to be completed within the WMS but in reality passes through two spreadsheets and a WhatsApp message on the way.
Specifically, map the following:
- For each step from receiving to shipping: who enters what, into which system, and at what point in time
- Every place where a spreadsheet or other manual file is involved
- Every place where the same information is entered more than once (double entry is the single strongest candidate for improvement, and it is almost always present)
- Every document that circulates on paper, and how many copies of each
- Every point at which somebody has to phone or message another department to find out a status
- Every report that exists because a customer asks for it in a specific format
This step is driven by interviews with the people doing the work, and it cannot be completed by an external vendor alone. Whether you can assign one respected key person from the operations floor to the project is, in our experience, one of the strongest predictors of whether the whole programme succeeds. That person does not need to be technical. They need to know what really happens on a bad Friday.
Step 2 (Months 1 to 2): Diagnose the Data
Next, assess the quality of the data already accumulated in your existing systems, using the three measures described earlier: master data duplication, transaction completeness, and manual entry ratio.
Sometimes the conclusion of this step is “there is not enough data to support AI.” That is not a failure. It is a correct diagnosis, and it is far cheaper to learn it in month two than in month fourteen. If you discover the shortfall early and respond by deferring the AI project by a year while spending that year building the data collection mechanism, you have avoided a wasted investment and produced a better plan. Framing it that way internally matters: the message to management is not “the project failed”, it is “we found the prerequisite and we are building it.”
A useful output of this step is a one-page data readiness statement for each candidate use case: what data the use case needs, whether it exists, how far back it goes, and what would have to change for it to be usable. That page prevents a great deal of argument later.
Step 3 (Months 2 to 5): A Small Proof of Concept
Run a proof of concept with a deliberately narrow scope. Our working definition of “small” is: it produces a result within three months, and if it fails, live operations do not stop.
Good candidates satisfy these conditions:
- The effect can be measured numerically (processing time, error count, inventory discrepancy)
- Few departments are involved (coordination cost rises sharply with each additional department)
- The impact on existing systems is limited
- The people doing the work already recognise it as a problem
The AI-OCR document processing described earlier tends to satisfy all four conditions, which is why it appears so often as a first project. But the conditions matter more than the specific technology; any candidate that meets them is a reasonable place to start.
One discipline is worth adding here: define the success criterion and the abandonment criterion at the same time. A PoC without a defined stopping rule tends to continue indefinitely in a state of “almost working”, consuming exactly the scarce internal capacity that the next project needs.
Step 4 (Months 5 to 7): Design the Guardrails
Once the PoC produces results, set the rules before you go into production. We call these the guardrails:
- Who approves the output that the AI or the system produces, and against what criteria
- How exceptions — cases the system cannot judge — are routed and handled, and by whom
- How anyone would notice if accuracy fell below expectations, and who owns that monitoring
- Data retention periods, access rights, and audit logging
- What the fallback process is when the system is unavailable, and how often that fallback is rehearsed
Skip this step and, six months after go-live, you will find yourself in a situation where nobody trusts the numbers the system produces, and a parallel spreadsheet has quietly reappeared as the real source of truth. With any AI-based mechanism in particular, it is essential to define operating rules on the assumption that the system will sometimes be wrong. A process designed for a system that is right 100% of the time is a process that fails the first time reality intervenes.
Step 5 (Months 7 to 12): Go Live and Embed
This is the deployment phase. The point to hold on to here is that going live is not the goal; embedding the change is the goal.
The most practical measure of embedding is how much exception handling outside the system is still occurring. As long as a parallel spreadsheet operation survives, your data remains fragmented and you cannot progress to the next layer. Track the number of workaround cases weekly, and treat each one as a design defect to be investigated rather than as an operator error to be corrected.
Training for local staff is concentrated in this period. As Thailand’s USD 200 million investment in logistics workforce training suggests, equipment and systems alone do not raise logistics productivity. Numbers only move once operators trust the system enough to use it as intended, including under time pressure. That trust is built by making sure the system is right about the things operators can verify with their own eyes — location, quantity, item identity — in the first weeks after go-live. Every early error in those basics costs months of credibility.
Practical points that make a disproportionate difference: train in the local language, train on the actual devices used on the floor rather than in a meeting room, and make sure at least two people per shift are confident enough to help others. A single trained super-user who then resigns is a common and entirely avoidable single point of failure.
Step 6 (Months 12 to 18): Roll Out and Move Up a Layer
Once the template exists at the first site, extend it to other sites and other processes. This is the stage at which return on investment begins to accelerate, because the design cost has already been paid and each additional deployment reuses it.
As noted, only 6% of organisations achieved a return within one year, and most reach a satisfactory return over two to four years. Understanding that being still in the investment phase at the eighteen-month mark is normal, not a warning sign, allows you to set the right internal evaluation criteria and defend the programme when a new executive asks why the money is not back yet.
The roll-out phase is also the right time to revisit the layer model. If the WMS and visibility layers are now genuinely solid at site one, the forecasting or optimisation use case that was unrealistic in month two may now be well supported by data. Programmes that keep a rolling list of deferred use cases, and re-test their feasibility every six months, get considerably more value from the same foundation than programmes that treat the original scope as fixed.
Three Failure Patterns We See Again and Again
Finally, three patterns we have watched repeat across many organisations.
1. Letting the vendor lead, and starting from features
When the conversation starts with “we have AI capability” and “we can automate this”, the scope of your project becomes the vendor’s product specification rather than your own problem. Remember that in the Inbound Logistics 2026 survey the top customer challenges were cost reduction at 85% and visibility at 80%. Articulate your own problem at that level of granularity first, then work backwards to the solution. It is slower to start and consistently cheaper and faster to finish.
A practical test: if you cannot state the problem without naming a technology, you have not defined the problem yet.
2. Trying to do everything at once
A large single-shot implementation carries too much downside if it fails. This is especially true at a local subsidiary with an IT team of one to three people, where simply running a large project to completion is beyond the available capacity. The statistic mentioned earlier — that organisations with no AI plans cite resource constraints rather than opposition — confirms how binding that limit is in practice.
The counter-argument you will hear is that phased implementation costs more in total. Sometimes it does. It also has a far higher probability of producing any benefit at all, and an expected value calculation that ignores probability of completion is not a calculation.
3. Involving the floor too late
Designing with head office and the IT department only, then handing the result to the operations floor shortly before go-live, provokes resistance almost every time. The people on the floor are professionals who run that operation every day, and they are the first to spot the omissions in your design. Bringing them in from the Step 1 inventory looks like a detour and is in fact the shortest path.
There is also a simpler reason. The design assumptions that get broken most often are the small ones — that a label is always readable, that a pallet always contains one item, that goods always arrive during working hours. Nobody in a meeting room knows about those. Everybody on the floor does.
Frequently Asked Questions
Where should we start with logistics digital transformation?
We recommend starting with a diagnosis of your current data quality. Rather than selecting a system first, check how much usable data has actually accumulated in your existing WMS or ERP: master data duplication, transaction completeness, and the proportion of fields entered by hand.
Based on that diagnosis, a good first project is one that can be started without modifying existing systems and that produces a measurable result within three months. AI-OCR for document processing usually fits both criteria. Given that the top customer challenges in the Inbound Logistics 2026 survey were cost reduction at 85% and visibility at 80%, it is also natural to define the first move not as “use AI” but as “reduce which cost, by how much” and work backwards from there.
One more suggestion: whatever you choose, measure the baseline before you change anything. A surprising number of projects deliver real improvement and cannot prove it, because nobody recorded the starting point.
How much does it cost to implement a WMS in Thailand?
Cost varies substantially with warehouse size, number of SKUs, the scope of integration with existing systems, and the number of custom documents and reports required, so a single figure would be misleading. Two projects both labelled “WMS implementation” can have completely different cost structures depending on whether standard functionality is sufficient or whether integration with a core ERP and EDI connections to customers is required.
Instead of a number, here is what to compare across quotations. Make sure all four of these are included, not just licence fees:
- Effort for data migration and master data cleansing
- Effort for on-site training, in the language your operators actually use
- The post-go-live support model, and specifically whether there are engineers in Thailand who can support the product
- The pricing structure for future functional additions and for additional users or sites
Item one is the one most often missing from a quotation and the one most likely to expand later, because its size depends on the state of your data rather than on the software.
It is also worth noting that Thailand’s renewed BOI incentives for 2026 to 2027 are in effect. According to Alvarez & Marsal’s analysis, a broad range of industries including logistics may be eligible for benefits such as corporate income tax exemption and import duty exemption, so confirming eligibility before finalising an investment plan can be worth real money.
Can warehouse automation pay back at a small or mid-sized site?
It depends on what you mean by automation. Physical automation equipment such as AS/RS and automated sorters produces benefits in proportion to throughput, so at a site whose volume has not reached a certain level, the depreciation and maintenance burden can exceed the labour cost removed. For those sites, a large capital installation is genuinely hard to justify.
The picture changes if you do not restrict “warehouse automation” to capital equipment. Software-centred measures — recording receipts and issues with handheld terminals, automating document processing, making inventory data available in real time, eliminating double entry between systems — have a much more achievable payback profile at small and mid-sized sites, because their cost scales with complexity rather than with volume.
As a practical diagnostic, we suggest measuring not “how long people spend moving” but how long people spend searching, entering data, and checking. Sites where those three categories are large still have substantial room for improvement without any capital investment at all. In our experience, the searching and checking time is usually far larger than management expects, and it is invisible precisely because it is distributed in small increments across the whole day.
On expectations: given that only 6% of organisations saw a return on AI investment within a year and most reached satisfactory returns over two to four years, positioning this as a medium-term investment is the realistic framing regardless of site size.
Which logistics processes does AI help with first?
In our experience, AI starts paying off with structuring unstructured data: taking information from customs documents, purchase orders and invoices that arrives as paper or PDF and getting it into your systems. This works independently of how complete your existing systems are, and the reduction in workload is visible to the people doing the job within weeks.
AI for demand forecasting and inventory optimisation has a larger potential impact, but it depends on several years of consistent, good-quality historical data. We believe the difficulty of that precondition is one reason why, in Sage’s 2026 survey, only 35% of logistics companies had AI in live operation, and only 10% in retail and wholesale supply chain operations.
So the realistic order is: document-oriented AI first, then visibility and data accumulation, then forecasting and optimisation AI. Each stage produces the input the next stage needs, which is why skipping a stage tends to cost more time than it saves.
To address the labour shortage, should we automate or outsource to a 3PL?
Both are valid options, and the deciding question is whether the process in question is directly connected to your competitive advantage.
For standard storage and transport, using a 3PL is often the rational choice, and the market is well developed: the Southeast Asian 3PL market is forecast to grow from USD 1,379.13 million in 2025 to USD 2,350.55 million in 2035, a CAGR of 5.34%, according to Report Ocean.
On the other hand, in-plant logistics that is tightly coupled to production, and any area where quality traceability is required, tends to suffer from data discontinuity when outsourced. You hand over the physical work but you still need the data, and you end up making the visibility investment anyway — sometimes at higher cost, because you now need it across an organisational boundary.
So even when you do outsource, agree at contract stage on the granularity and frequency of the operational data you will receive: not “monthly performance reports” but the transaction-level records you would have had if you ran the operation yourself. That clause is far easier to negotiate before signature than after.

Conclusion
Here is where Southeast Asia logistics digital transformation stands in 2026, in numbers.
- The Southeast Asian warehouse automation market is forecast to grow from USD 910 million in 2026 to USD 1.63 billion in 2031, a CAGR of 12.36% (Mordor Intelligence)
- Thailand’s freight and logistics market is forecast to grow from USD 53.38 billion in 2025 to USD 56.56 billion in 2026 and USD 75.47 billion in 2031, a CAGR of 5.95%. Investment in automation is growing more than twice as fast as the market itself
- Retail and e-commerce holds the largest share of the warehouse automation market at 33.40% with a CAGR of 17.28%. The segment driving regional automation is e-commerce, not manufacturing
- In Thailand, logistics drivers are hard to secure even at THB 25,000 per month including overtime; wage increases at Japanese-affiliated companies ran at 3.8% in 2023, 4.58% in 2024 and a projected 4.64% in 2025; and the working-age population is expected to begin declining from 2026 (JETRO)
- 77% of vendors offer AI capability, while AI is in live production at 35% of logistics companies and at only 10% of retail and wholesale supply chain operations (Inbound Logistics 2026 survey; Sage, 2026 State of Supply Chain Report)
- 85% of organisations increased AI investment, but only 6% achieved a return within twelve months. Most reach satisfactory returns over two to four years (2026 statistics compiled by RELEX Solutions and Open Sky Group)
What we take from all of this is simple. Success with logistics AI in ASEAN is decided by the state of your data far more than by your choice of technology. The warehouse automation market can grow at 12% a year, and 77% of vendors can offer AI, and none of it will produce results if the data coming out of your own operation is not structured. The reverse is also true, and more encouraging: where the data is in good shape, there are areas where a relatively small investment delivers real results quickly.
On expectations, plan for a two to four year payback and design the first eighteen months as a sequence: inventory the process and data, diagnose data quality, run a small proof of concept, design the guardrails, go live and embed, then roll out. A plan built on a twelve-month payback has a high probability of being stopped before it reaches the point where it would have paid.
TOMAS TECH supports IT implementation for factories and warehouses in Thailand and neighbouring countries from our base in Bangkok. Our work spans the PEGASUS production management system, IoT-based equipment data collection, AI-OCR automation of customs and order documents, energy management, and FA and robot control solutions. In every case we start from the same place: getting the data on your floor into a form you can actually use.
“We implemented a WMS but we are not getting the value out of it.” “We want to look at automation but we do not know where to begin.” “We are struggling to explain the ROI to head office.” These are the conversations we have most often. A good first step is simply to review together what condition your current data is in. Get in touch, and we will propose a realistic starting point based on your specific situation rather than on a standard package.
References
- Mordor Intelligence, “Southeast Asia Warehouse Automation Market”: https://www.mordorintelligence.com/industry-reports/south-east-asia-warehouse-automation-market
- GII, “Thailand Freight and Logistics Market 2026-2031”: https://www.gii.co.jp/report/moi1939641-thailand-freight-logistics-market-share-analysis.html
- @Press / Report Ocean, “Southeast Asia Third-Party Logistics Market 2026-2035”: https://www.atpress.ne.jp/news/4432677
- Inbound Logistics, “2026 Logistics IT Trends”: https://www.inboundlogistics.com/articles/2026-perspectives-and-market-research-logistics-it-accelerates/
- RELEX Solutions, “Supply chain AI in 2026: The numbers behind the hype”: https://www.relexsolutions.com/resources/supply-chain-ai/
- Open Sky Group, “Supply Chain AI Statistics 2026”: https://openskygroup.com/supply-chain-ai-statistics/
- Lexology, “Thailand Advances Landmark Land Bridge Mega Project”: https://www.lexology.com/library/detail.aspx?g=af7a31e1-c8ab-4a28-b9a6-80050051d2f7
- Alvarez & Marsal, “Thailand’s Renewed BOI Incentives (2026-2027)”: https://www.alvarezandmarsal.com/thought-leadership/thailand-s-renewed-boi-incentives-a-strategic-window-for-growth-expansion-and-investment-2026-2027
- JETRO, “Labour shortages in Thailand and responses, with attention to minimum wage trends”: https://www.jetro.go.jp/biz/areareports/special/2024/0303/f5b4d6344434b2a9.html
- VOV, “VILOG 2026 to showcase Vietnam’s shift toward smart and green logistics”: https://english.vov.vn/en/economy/vilog-2026-to-showcase-vietnams-shift-toward-smart-and-green-logistics-post1315916.vov


